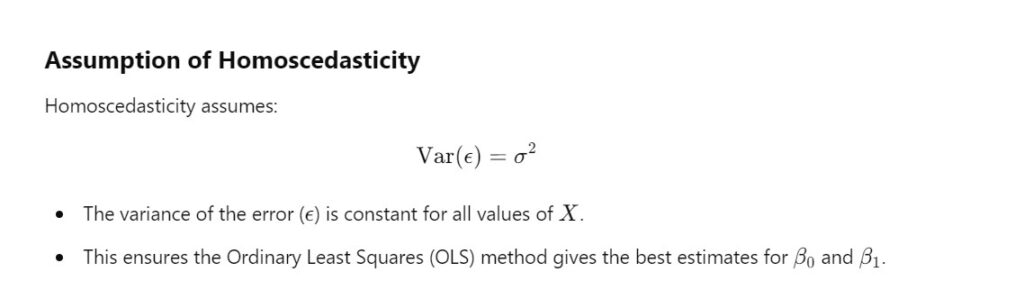
Homoscedasticity is an assumption in linear regression that the variance of the errors (residuals) is constant across all levels of the independent variables.
In other words, the spread of residuals should be roughly the same for all predicted values of the dependent variable.
(2) Why Is Homoscedasticity Important?
Homoscedasticity is a key assumption in linear regression because:
Accuracy of Predictions: When the variance of residuals is constant, the model’s predictions are more reliable.
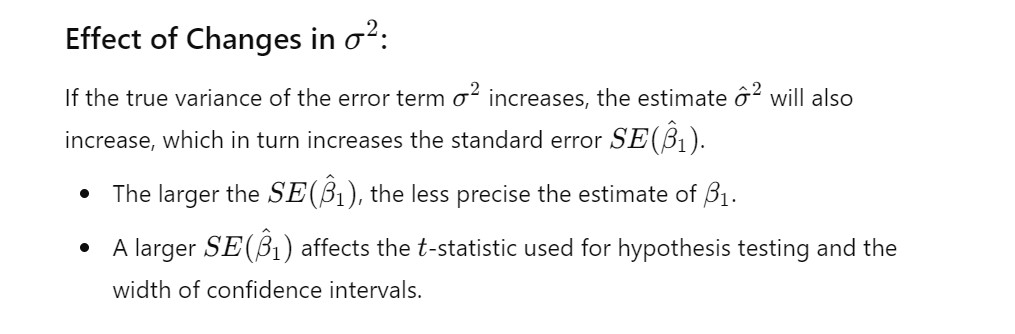
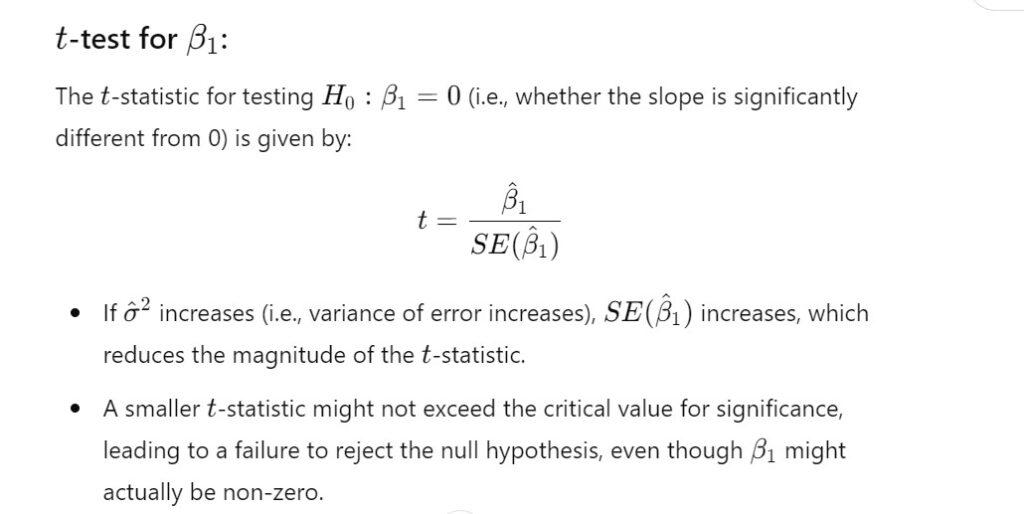
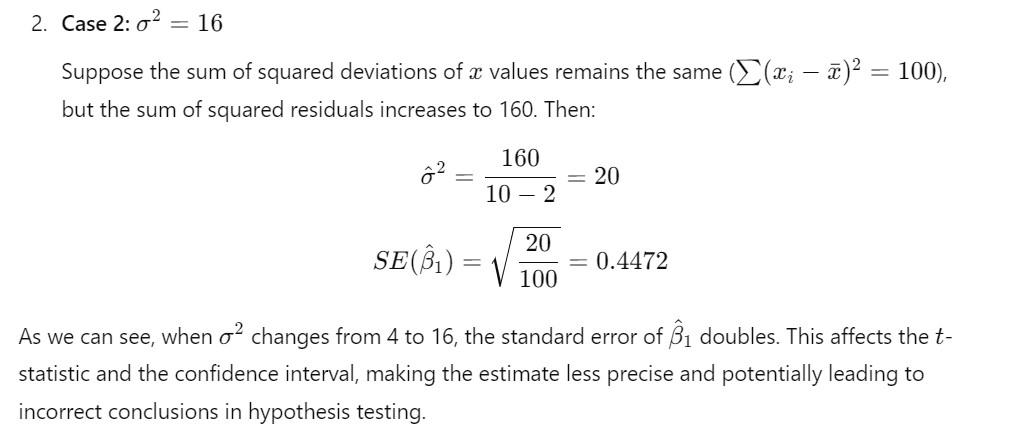
Valid Hypothesis Tests: Statistical tests like the t-test and F-test rely on the assumption of homoscedasticity for valid results.
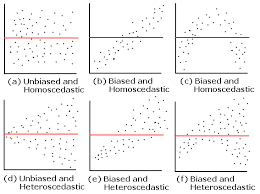
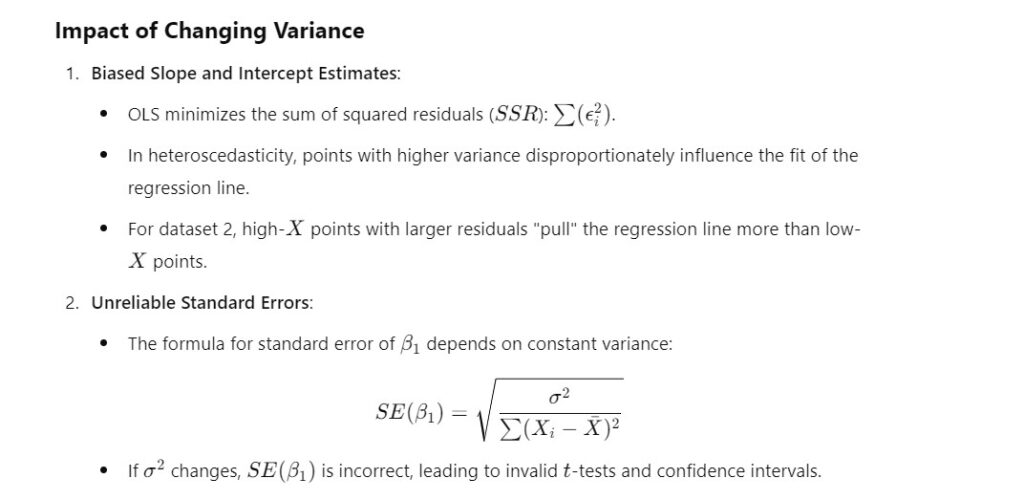
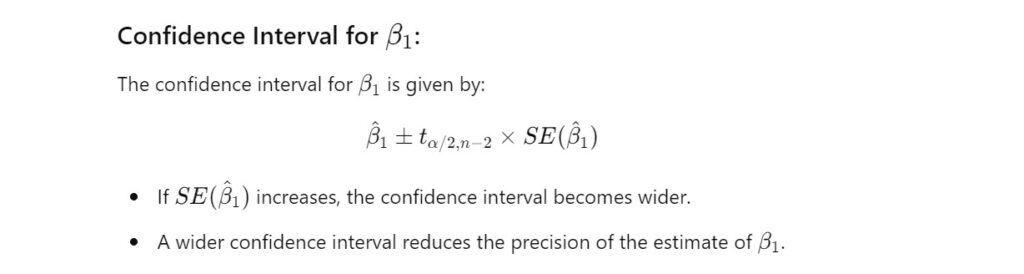
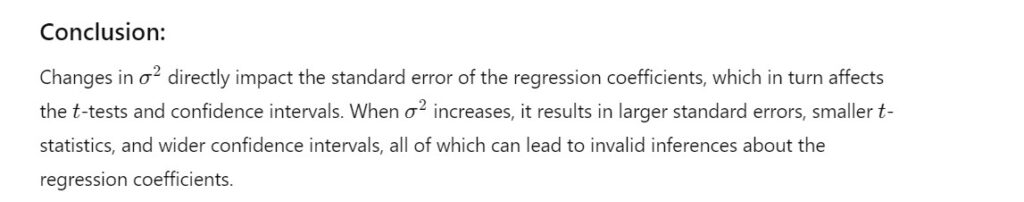
Minimized Bias: Violations of this assumption (heteroscedasticity) can lead to biased standard errors, affecting confidence intervals and hypothesis testing.
(3) How to Identify Homoscedasticity?
You can check for homoscedasticity by analyzing the residuals:
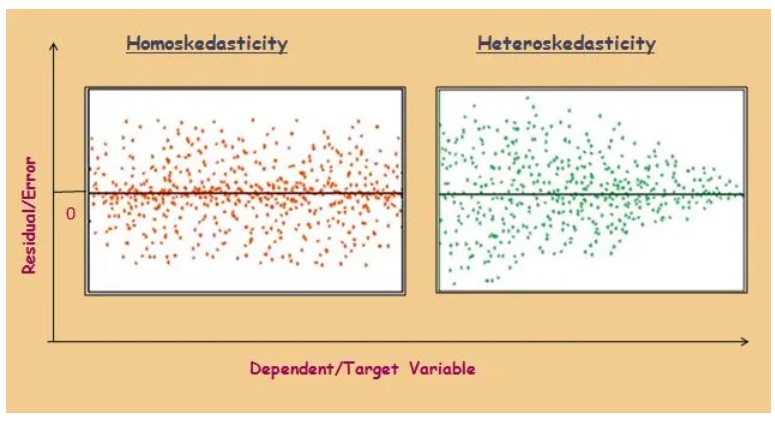
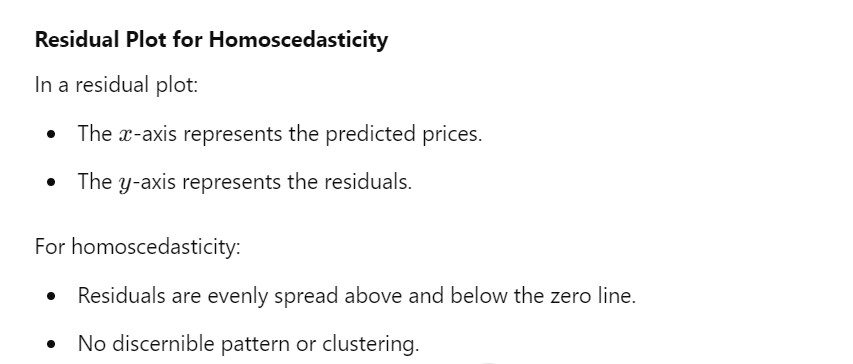
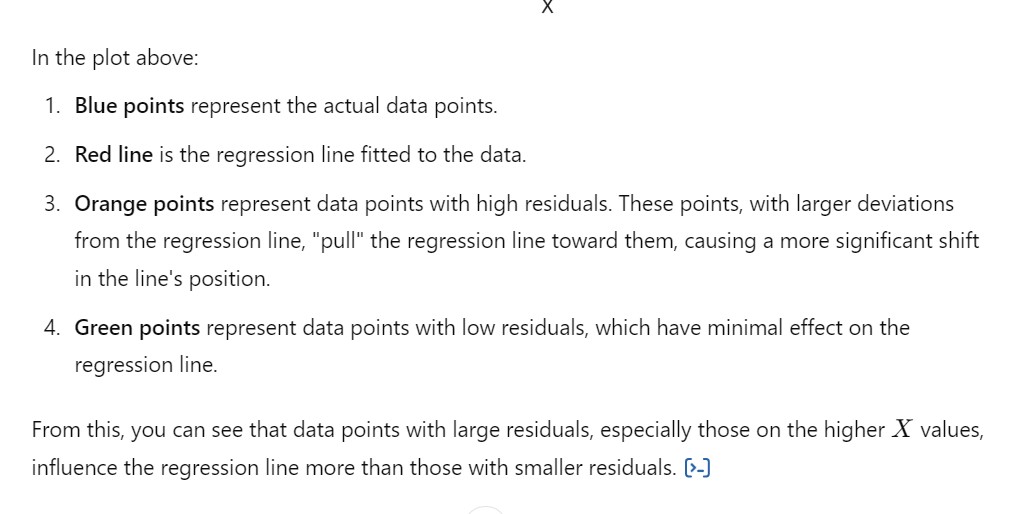
Residual Plot:
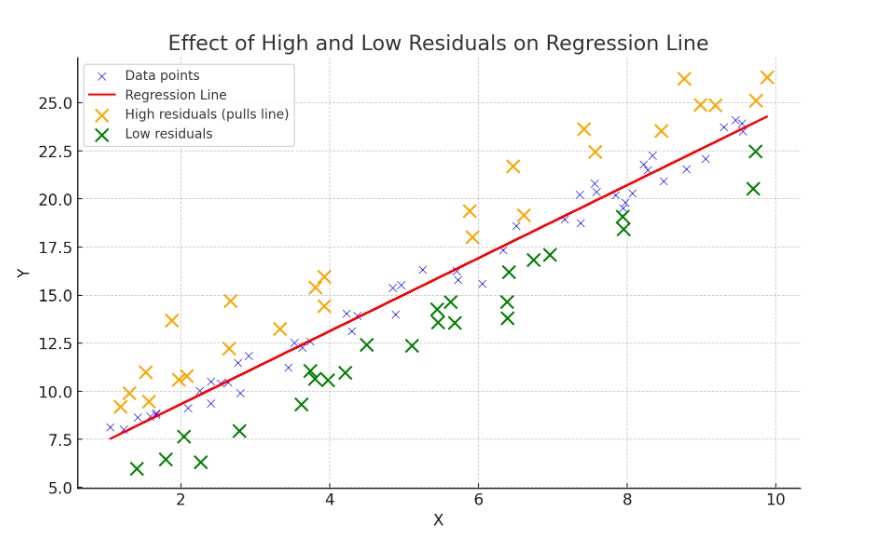
Plot the residuals (errors) on the yyy-axis against the predicted values (or independent variables) on the xxx-axis.
Look for a random scatter of points without a clear pattern.
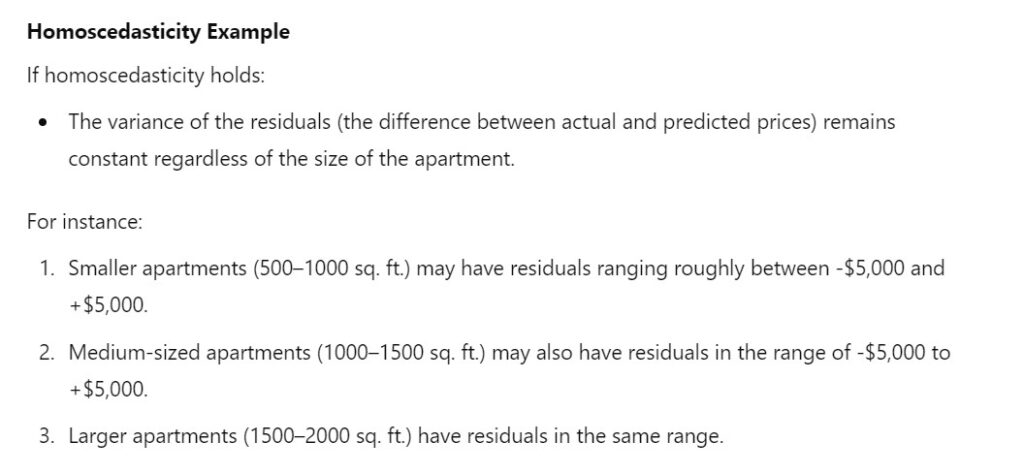
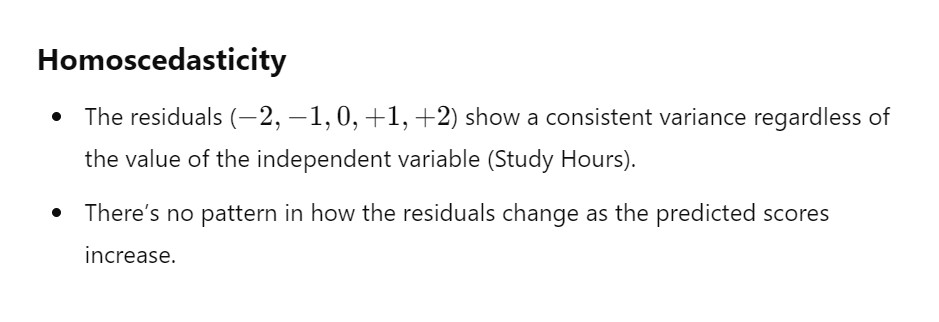
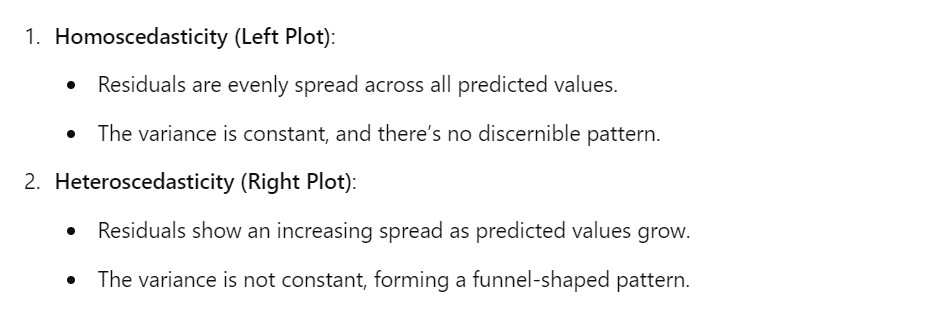
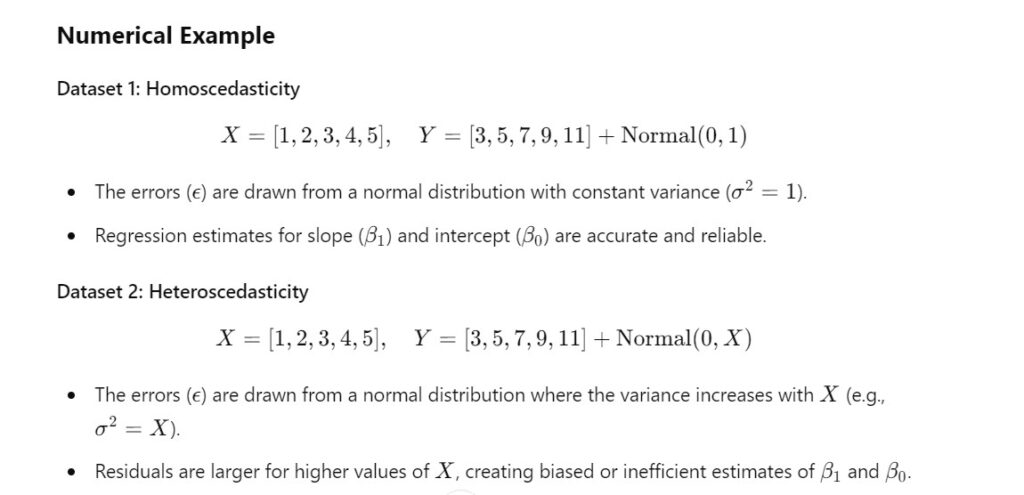
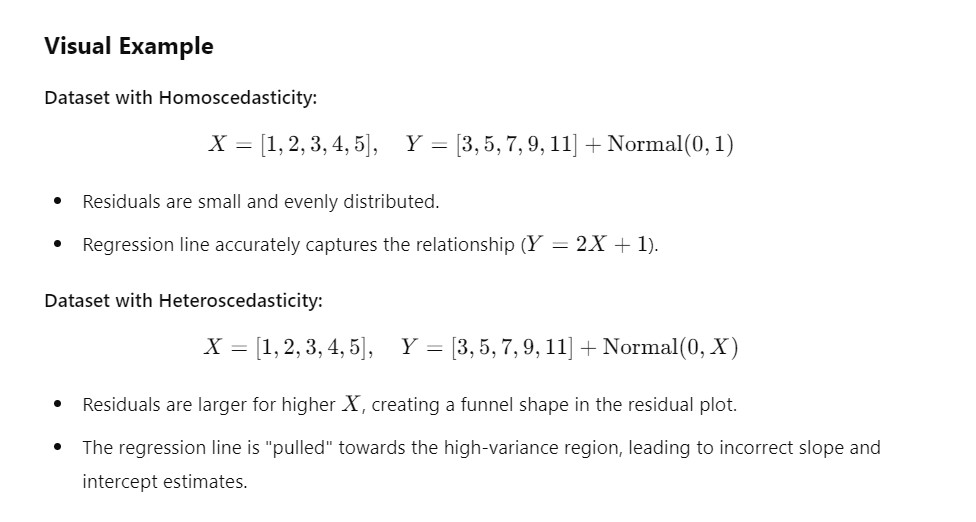
Homoscedasticity: Residuals have equal spread across all values.
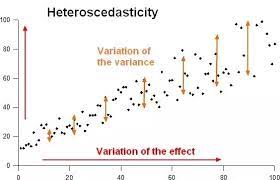
Heteroscedasticity: Residuals form a pattern (e.g., funnel shape, increasing or decreasing variance).
Statistical Tests:
Breusch-Pagan Test: Tests if the residual variance depends on the predicted values.
White’s Test: A more general test for heteroscedasticity.
(4) Example Of Homoscedasticity.
Homoscedasticity:
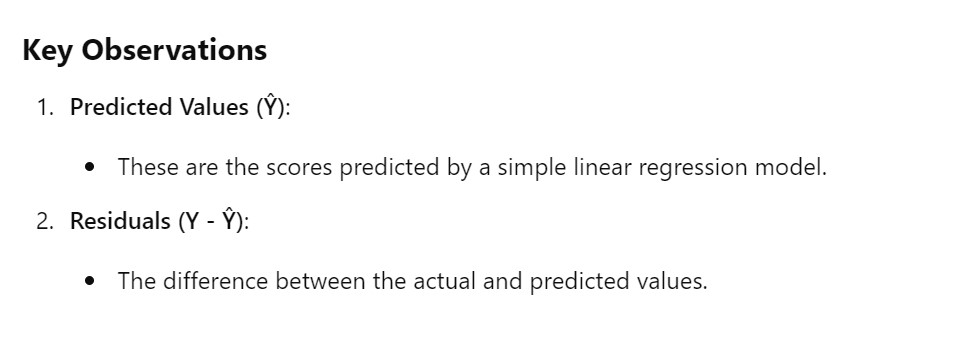
Suppose you’re predicting house prices based on square footage. The variance of prediction errors is constant across small and large houses.
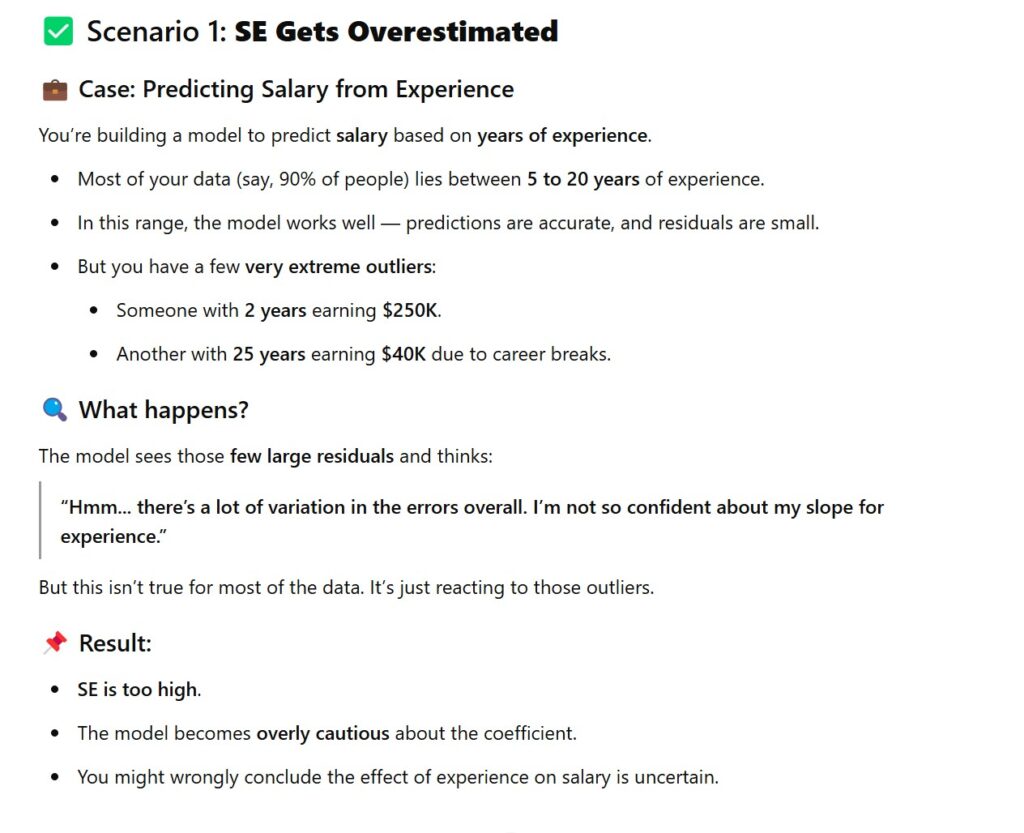
Heteroscedasticity:
Predicting income based on age: Younger individuals might have a smaller spread of incomes (e.g., low-paying entry-level jobs), while older individuals could have a wider spread (e.g., executive positions vs. retirees).