R-squared, also known as the coefficient of determination, is a statistical measure that shows how well the independent variable(s) in a regression model explain the variability of the dependent variable.
It provides an indication of the model’s goodness of fit.
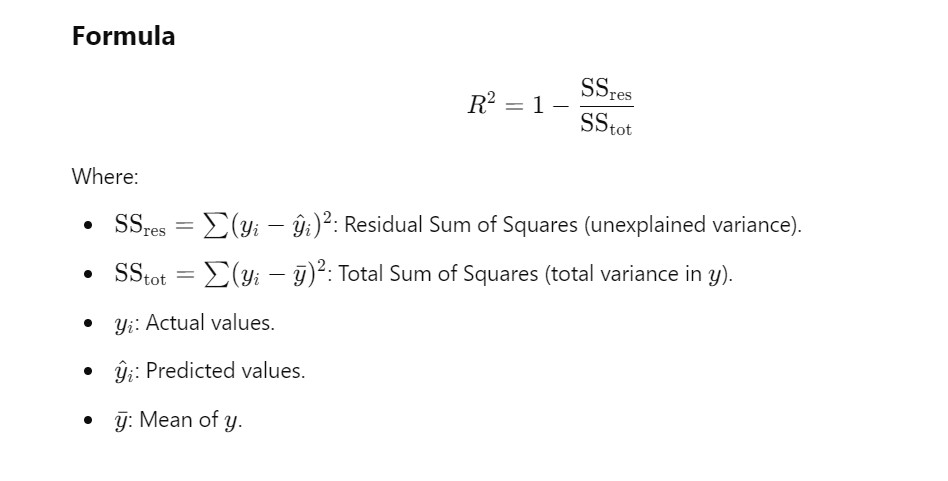
(2) Formula For R Squared Value
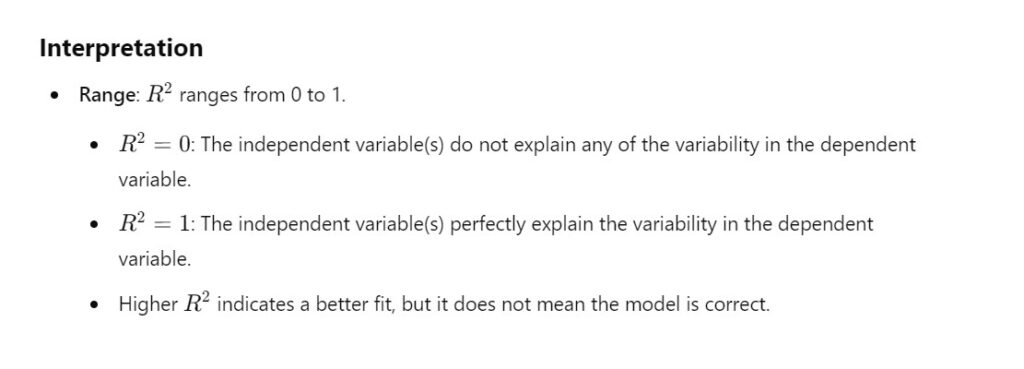
(3) Interpretation Of R-Squared
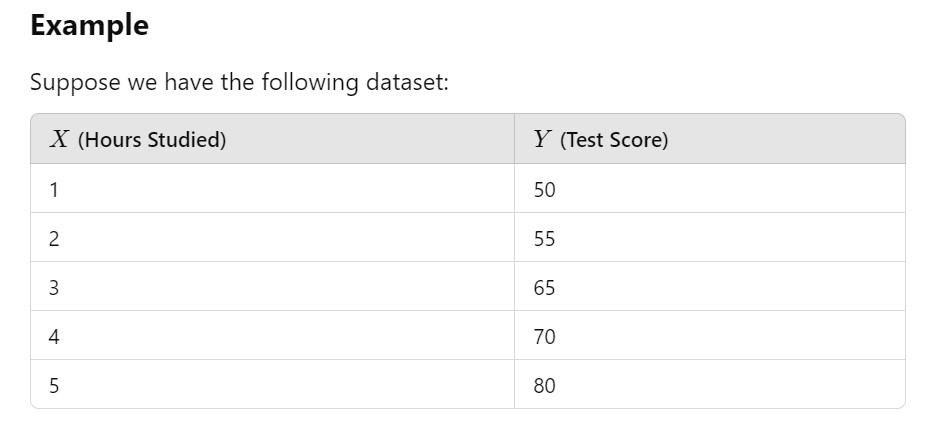
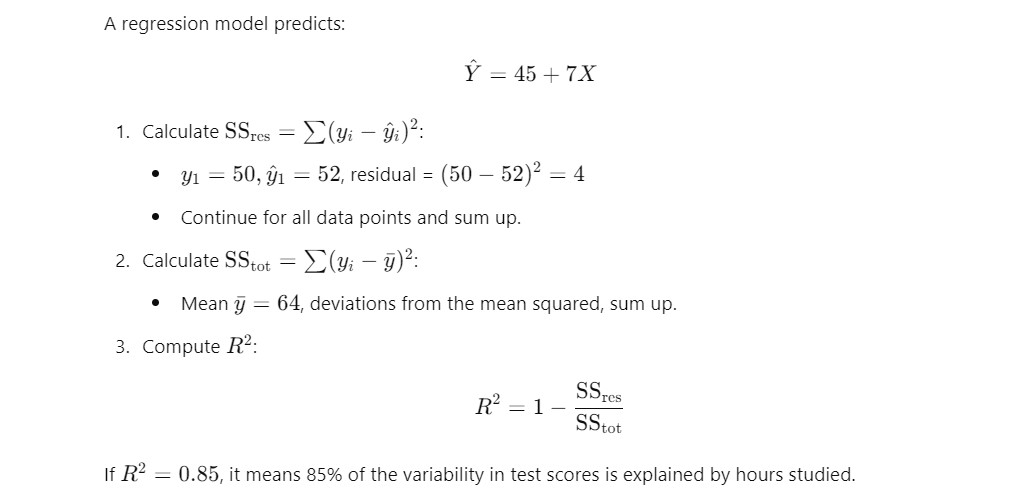
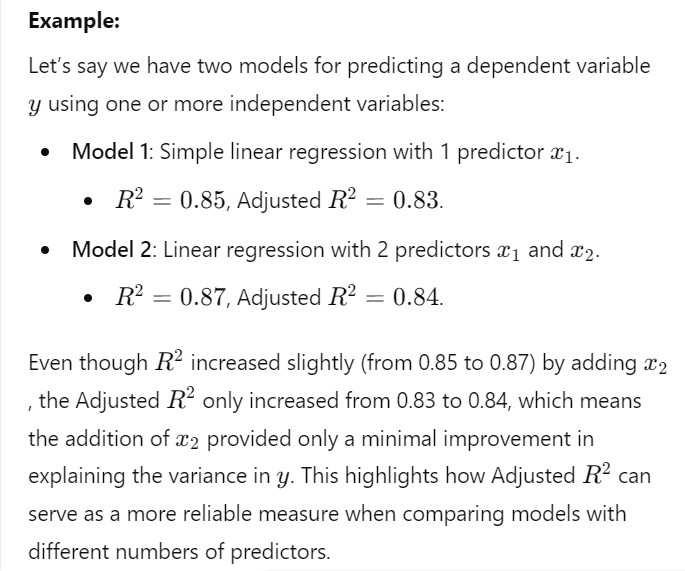
(4) Example Of R-Squared
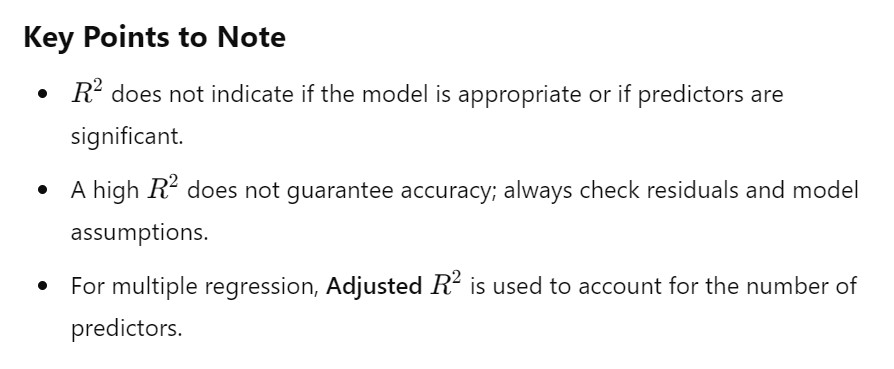
(5) Key Points To Note
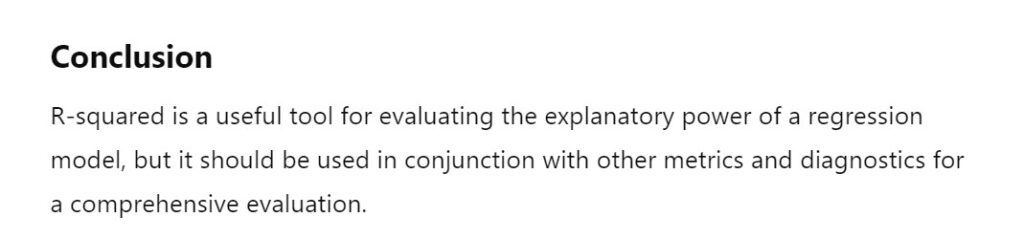
(6) Conclusion
(7) Adjusted R-Squared
Adjusted R-squared is a modified version of the traditional R-squared that accounts for the number of independent variables (predictors) in a regression model.
Unlike R2, which always increases as more predictors are added to the model,Adjusted R-squared penalizes the model for adding predictors that do not improve the model significantly.
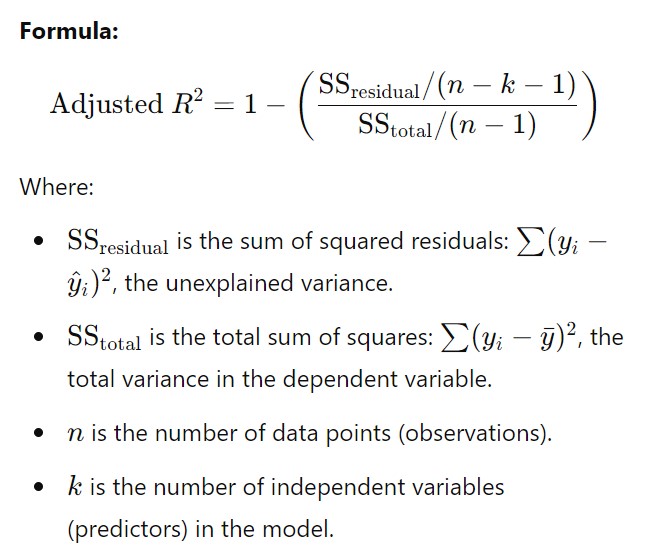
(8) Formula For Adjusted R-Squared
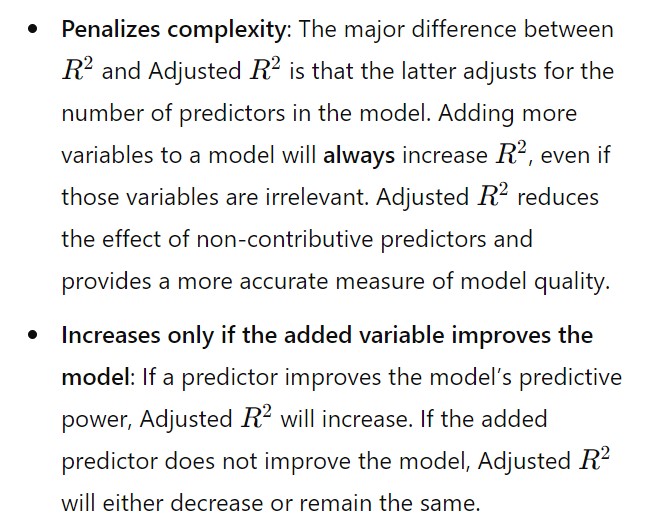
(9) Why Use Adjusted R-Squared?
(10) Key Points Of Adjusted R-Squared?
Penalty for Extra Variables:
Adjusted R2R^2R2 penalizes the inclusion of additional predictors unless they improve the model’s explanatory power significantly.
If adding a predictor does not improve the model, Adjusted R2R^2R2 decreases.
Comparison with R- Squared:
R2 increases or stays constant as predictors are added, even if those predictors are irrelevant.
Adjusted R2 adjusts for the number of predictors, ensuring only meaningful improvements are rewarded.
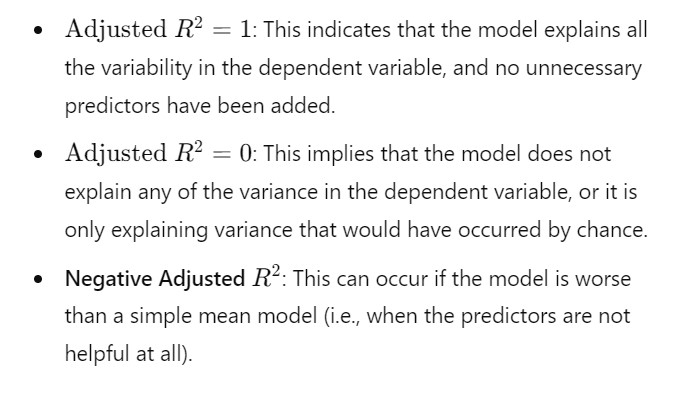
Range:
Adjusted R2 is always less than or equal to R2.
It can be negative if the model performs worse than a simple mean-based model.
Usefulness:
Adjusted R2 is particularly useful when comparing models with different numbers of predictors.