admin
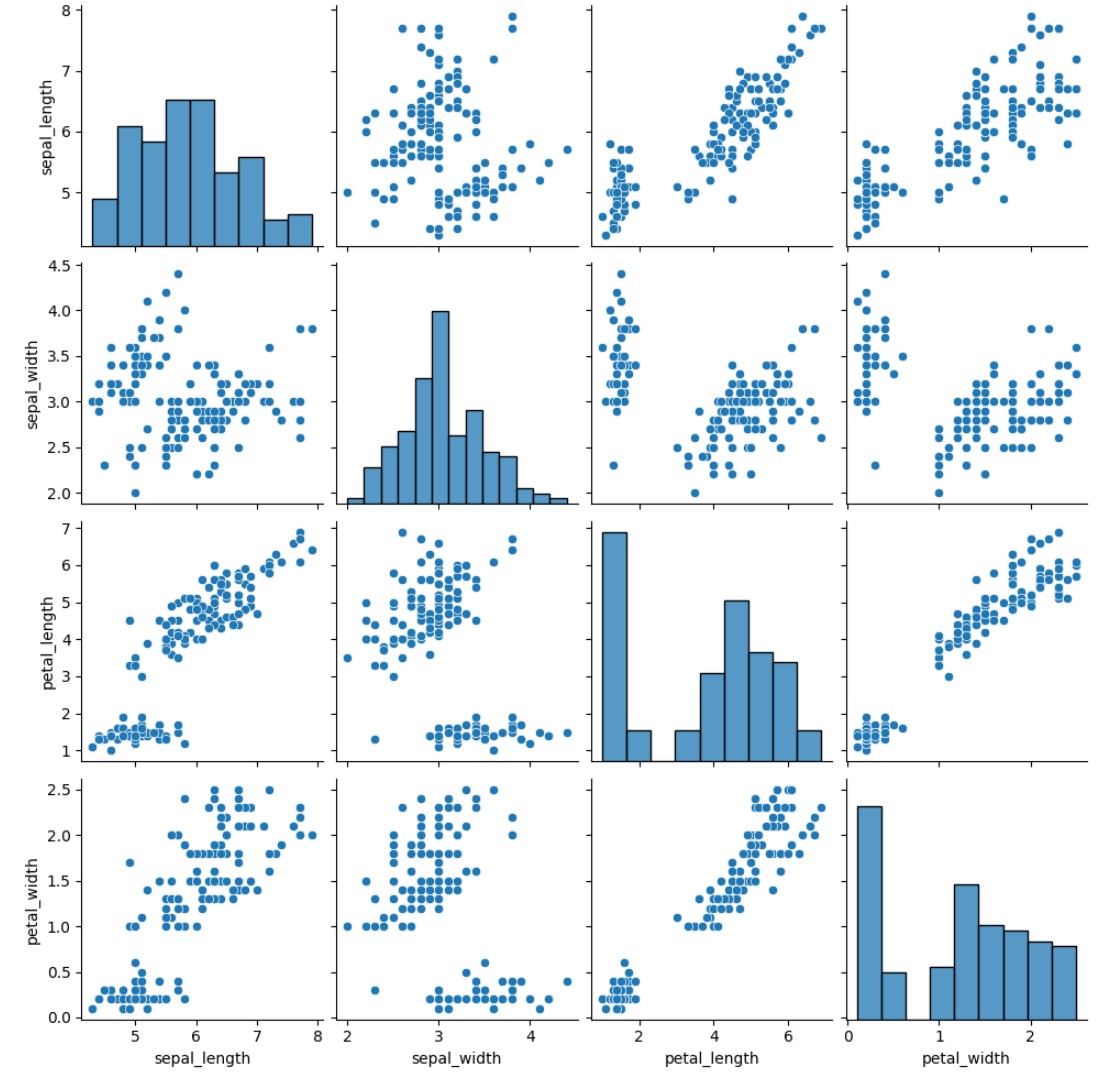
import seaborn as sns
import matplotlib.pyplot as plt

# Load built-in Iris dataset
iris = sns.load_dataset("iris")

# Create a pair plot
sns.pairplot(iris)

plt.show()
import seaborn as sns
import matplotlib.pyplot as plt

# Load built-in Iris dataset
iris = sns.load_dataset("iris")

# Create a pair plot
sns.pairplot(iris, hue="species")

plt.show()
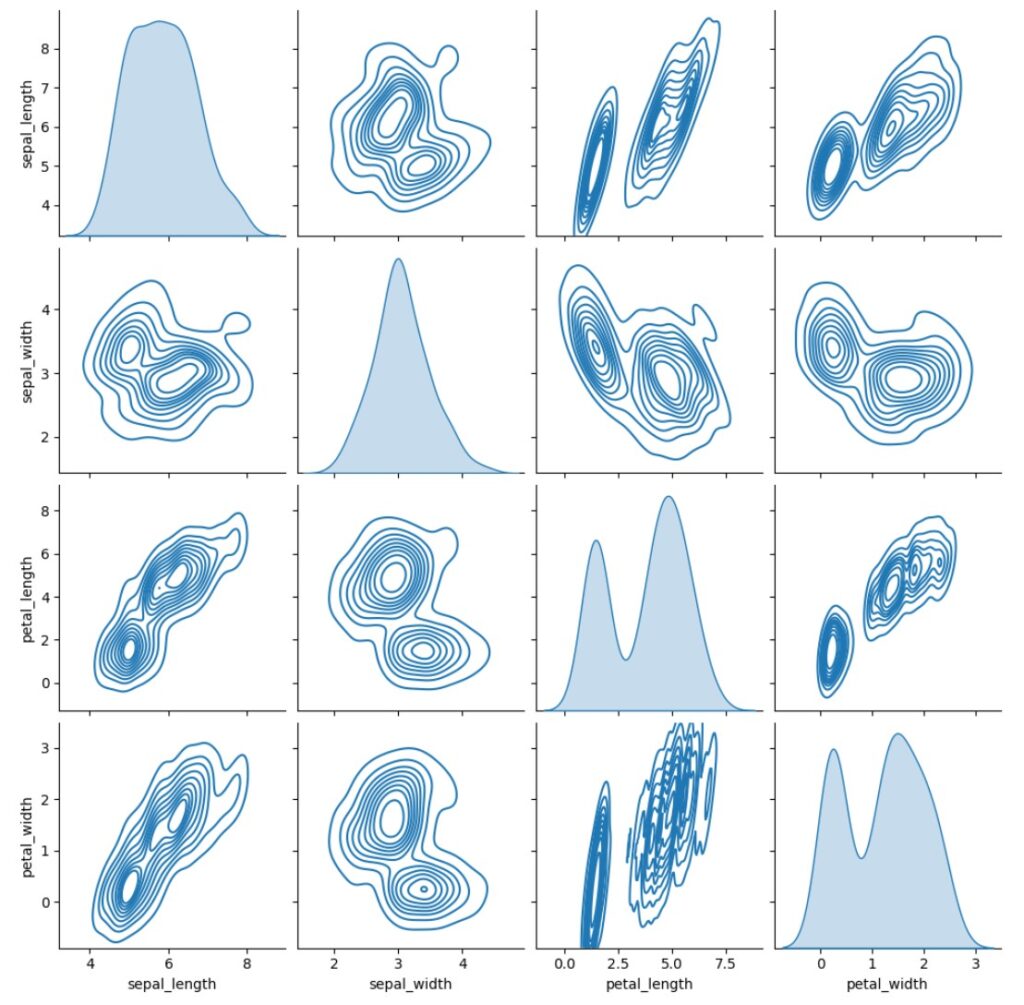
import seaborn as sns
import matplotlib.pyplot as plt

# Load built-in Iris dataset
iris = sns.load_dataset("iris")

# Create a pair plot
sns.pairplot(iris, kind="kde")

plt.show()
Your email address will not be published. Required fields are marked *
Comment *
Name *
Email *
Website
Save my name, email, and website in this browser for the next time I comment.