-
Logistic Regression : Precision & Recall
Logistic Regression – Precision & Recall
-
Logistic Regression – “Log Loss” Solution For Accuracy Loopholes .
Logistic Regression : “Log Loss” Solution For Accuracy Loopholes .
-
Logistic Regression – Accuracy Loopholes
Logistic Regression : Accuracy Loophoals
-
Logistic Regression
No posts found.
-
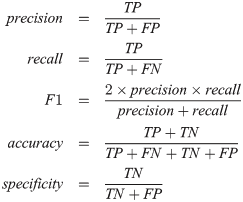
Logistic Regression : Accuracy, Precision, Recall, F1-Score
Confusion Metrics, Accuracy, Precision, Recall, F1-Score Table Of Contents: Confusion Metrics Accuracy Precision Recall F1-Score Specificity (True Negative Rate) Fall-Out : False Positive Rate (FPR) Miss Rate: False Negative Rate (FNR) Balanced Accuracy Example Of Confusion Metrics Confusion Metrics For Multiple Class (1) Confusion Metrics A confusion matrix is a tabular representation of the performance of a classification model. It helps visualize and understand how well a model’s predictions align with the actual outcomes, especially in binary and multi-class classification. (2) Structure Of Confusion Metrics Definition: (3) Accuracy For imbalanced dataset Accuracy will give the wrong impression about the model
-
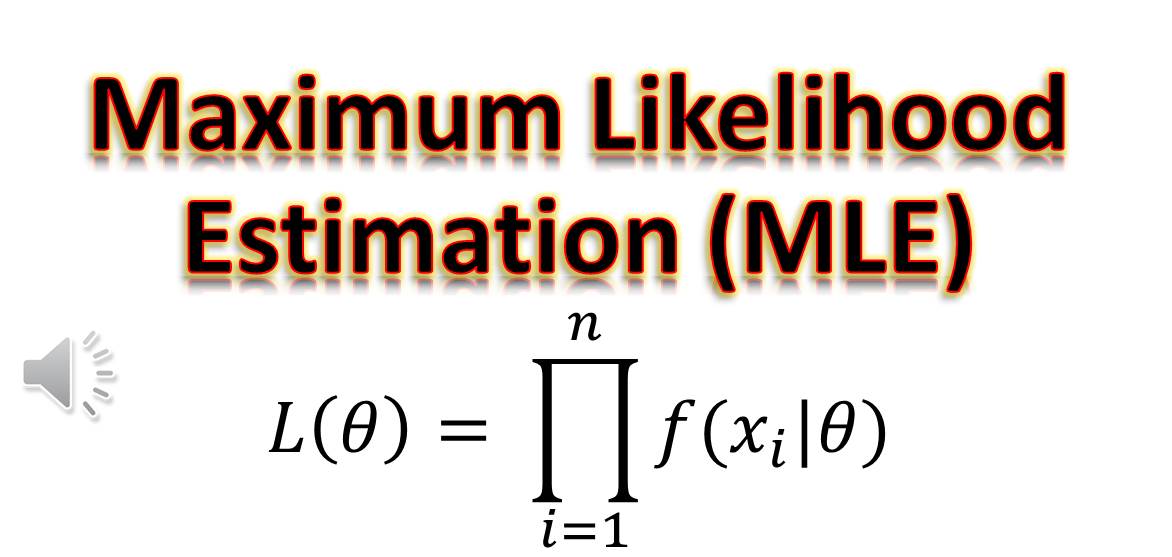
Why We Use Maximum Likelihood Estimation In Logistic Regression?
Why We Use Maximum Likelihood Estimation In Logistic Regression? Maximum Likelihood find out where the Probability is maximum. Minimizing the Loss identifies where the loss is minimum. Table Of Contents: Difference In Maximizing Likelihood and Minimum Loss. (1) How To Find Maximum Likelihood? (2) Maximum Likelihood For Logistic Regression (3) Difference In Maximizing Likelihood and Minimum Loss. (2) Why Differentiating To Zero Gives Us Maximize Log-Likelihood: Differentiating a function and setting it equal to zero helps us find the critical points, which could be maxima, minima, or saddle points. In the context of Maximum Likelihood Estimation (MLE), this principle is
-

Logistic Regression Topics.
Logistic Regression Topics Table Of Contents: Introduction to Logistic Regression Mathematical Foundation Model Fitting Assumptions of Logistic Regression Feature Engineering for Logistic Regression Evaluation Metrics for Logistic Regression Regularization in Logistic Regression Advanced Topics Model Interpretation Practical Considerations Common Problems in Logistic Regression Implementation in Programming Applications of Logistic Regression (1) Introduction to Logistic Regression (2) Assumptions of Logistic Regression (3) Mathematical Foundation (4) Model Fitting (5) Feature Engineering for Logistic Regression (6) Evaluation Metrics for Logistic Regression (7) Regularization in Logistic Regression (8) Extensions of Logistic Regression (9) Challenges and Solutions (10) Advanced Topics (11) Model Interpretation (12) Practical
-
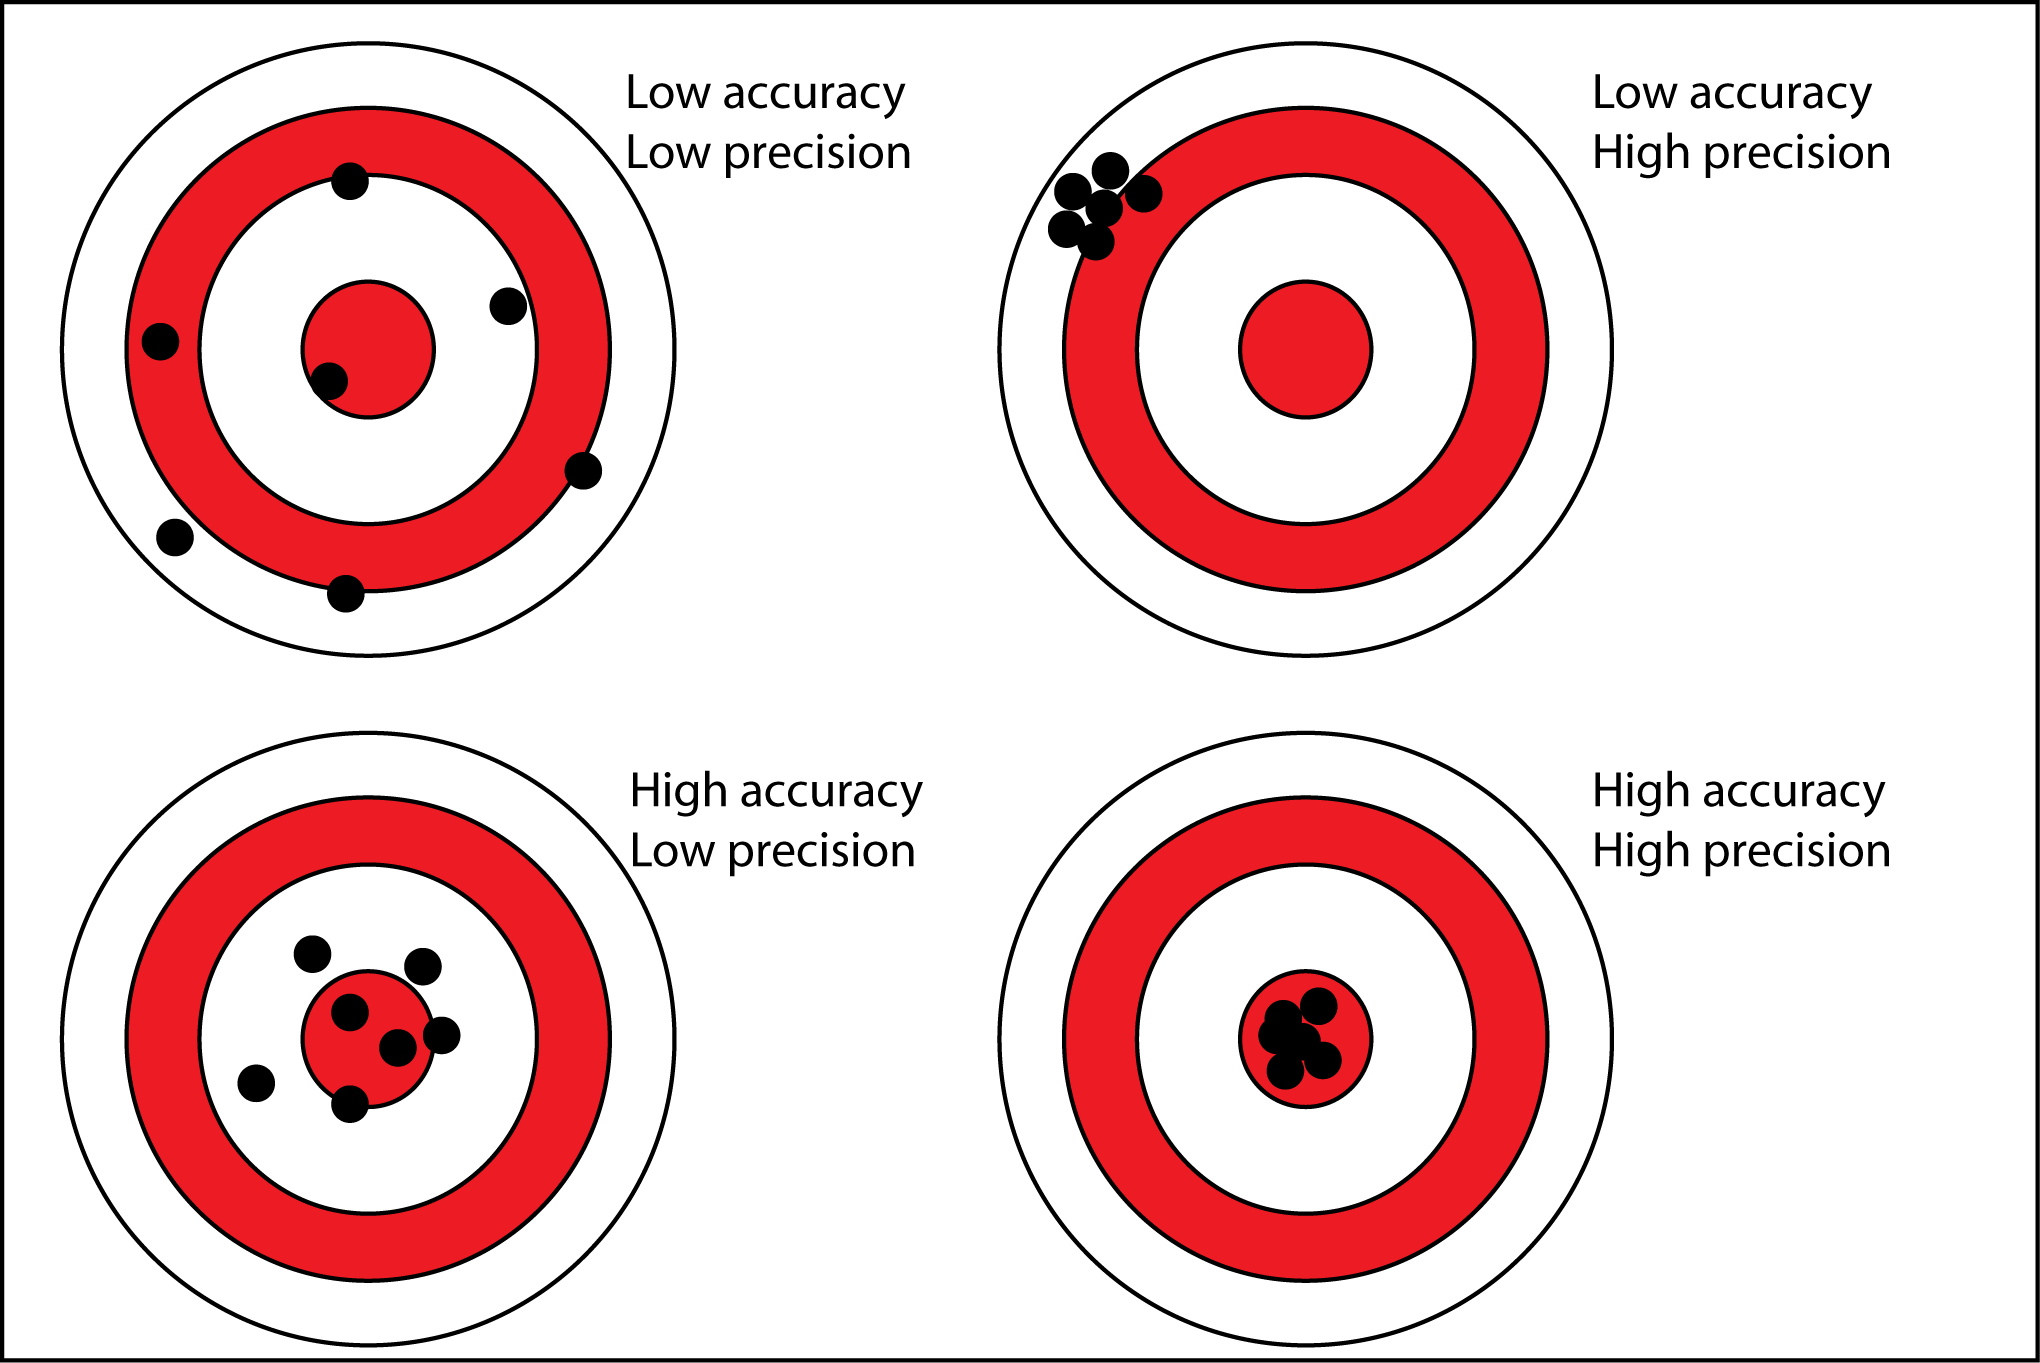
Binary Class Evaluation Metrices.
Evaluation Matrixes Table Of Contents: Accuracy Precision Recall (TPR, Sensitivity) Specificity (TNR) F1-Score FPR (Type I Error) FNR (Type II Error) (1) Accuracy: Accuracy simply measures how often the classifier makes the correct prediction. It’s the ratio between the number of correct predictions and the total number of predictions. The accuracy metric is not suited for imbalanced classes. Accuracy has its own disadvantages, for imbalanced data, when the model predicts that each point belongs to the majority class label, the accuracy will be high. But, the model is not accurate. It is a measure of correctness that is achieved in true prediction. In simple words, it tells us how many predictions are actually positive out
-
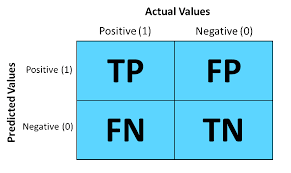
Confusion Metrix
Confusion Metrix Table Of Contents: What Is Confusion Metrix? Why We Need Confusion Metrix? Elements Of Confusion Metrix. Examples Of Confusion Metrix. Evaluation Matrixes. (1) Why We Need Confusion Metrix? In machine learning, Classification is used to split data into categories. But after cleaning and preprocessing the data and training our model, how do we know if our classification model performs well? That is where a confusion matrix comes into the picture. A confusion matrix is used to measure the performance of a classifier in depth. (2) What Is Confusion Metrix? A confusion matrix, also known as an error matrix,
-
Interpretation Of Logistic Regression Coefficients.
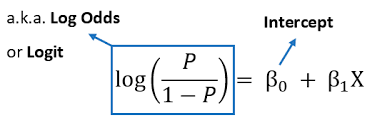
Interpretation Of Logistic Regression Coefficients. Table Of Contents: Understanding Logistic Regression Model. What Is Odd Ratio? What Is Log Odd Ratio? Examples Of Coefficients Interpretation. From Log Odds To Probability. Interpreting Coefficients. Examples Of Interpreting Coefficients. Interpreting Standard Error. How To Interpret Intercept? Odd Ratio Interpretation. More Reading Links. (1) Understanding Logistic Regression Model. Here’s what a Logistic Regression model looks like: You notice that it’s slightly different from a linear model. Let’s clarify each bit of it. logit(p) is just a shortcut for log(p/1-p), where p = P{Y = 1}, i.e. the probability of “success”, or the presence of an outcome. X₁