-
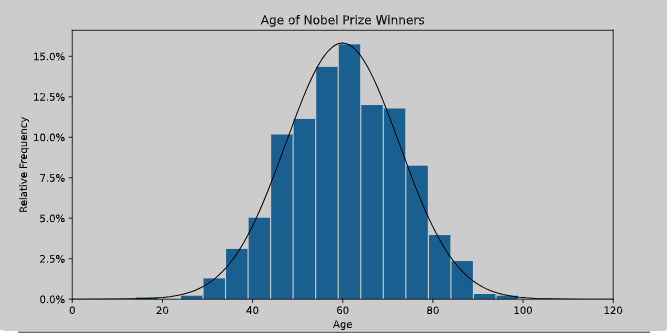
Linear Regression – Assumption – 3(Normal Distribution Of Error Term)
Normal Distribution Of Error Term Table Of Contents: What Is A Normal Distribution? Why Normal Distribution Is Matter? Why Is Error Term Should Be Normally Distributed? Remedies For Non-Normal Error Distribution. (1) What Is A Normal Distribution? In a normal distribution, data is symmetrically distributed with no skew. When plotted on a graph, the data follows a bell shape, with most values clustering around a central region and tapering off as they go further away from the center. Normal distributions are also called Gaussian distributions or bell curves because of their shape. (2) Why Normal Distribution Is Important? All kinds of variables in
-
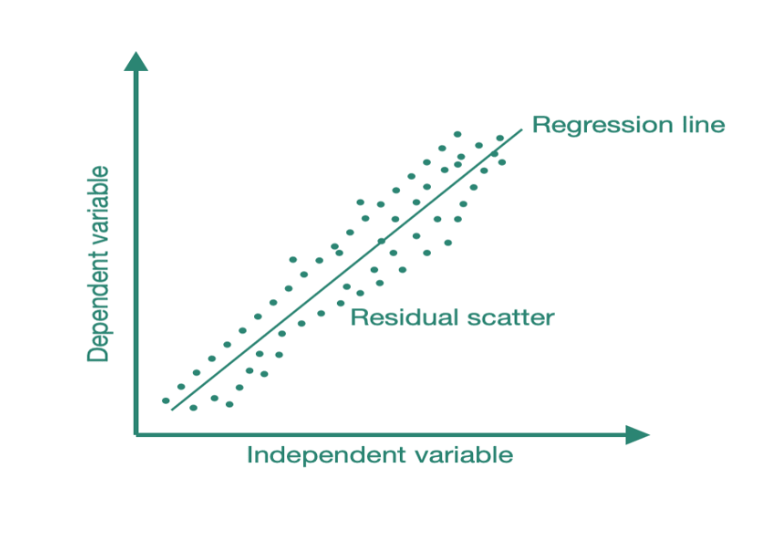
Linear Regression – Assumption – 4 (What Is Homoscedasticity ?)
What Is Homoscedasticity? Table Of Contents: What Is Homoscedasticity? What Is Heteroscedasticity? Example Of Home & Heteroscedasticity. Problem With Heteroscedasticity. Test For Heteroscedasticity. The Importance Of Homoscedasticity. Why Does Heteroscedasticity Occur? How To Remove Heteroscedasticity? (1) What Is Homoscedasticity? Homoscedasticity, or homogeneity of variances, is an assumption of equal or similar variances in different groups being compared. This is an important assumption of parametric statistical tests because they are sensitive to any dissimilarities. Uneven variances in samples result in biased and skewed test results. Homoscedasticity describes a situation in which the error term (that is, the “noise” or random disturbance in the relationship between
-
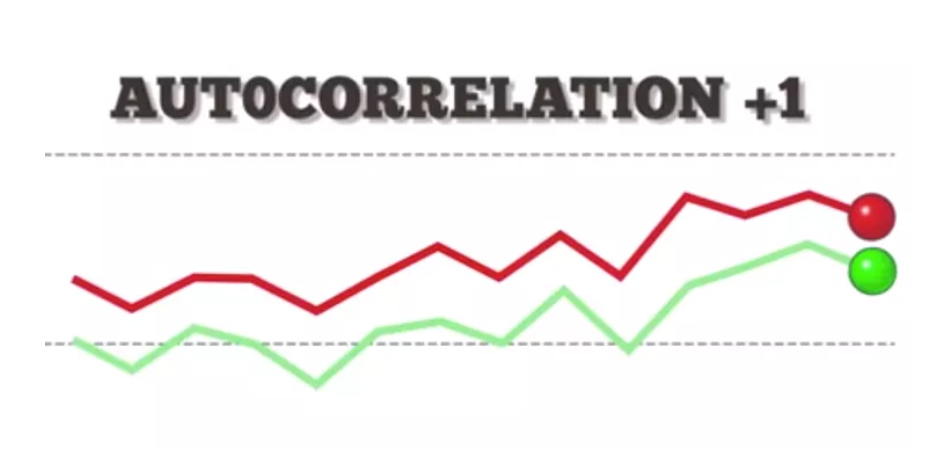
Linear Regression – Assumption – 5 (What Is Auto Correlation ?)
What Is Auto Correlation Table Of Contents: What Is Autocorrelation? Types Of Autocorrelation. How To Test For Autocorrelation? Example Of Autocorrelation. The implications of autocorrelation. Durbin-Watson Test In Python. How To Remove Autocorrelation In Model? (1) What Is Autocorrelation? Autocorrelation refers to the degree of correlation of the same variables between two successive time intervals. It measures how the lagged version of the value of a variable is related to the original version of it in a time series. Autocorrelation, as a statistical concept, is also known as serial correlation. The analysis of autocorrelation helps to find repeating periodic patterns,
-
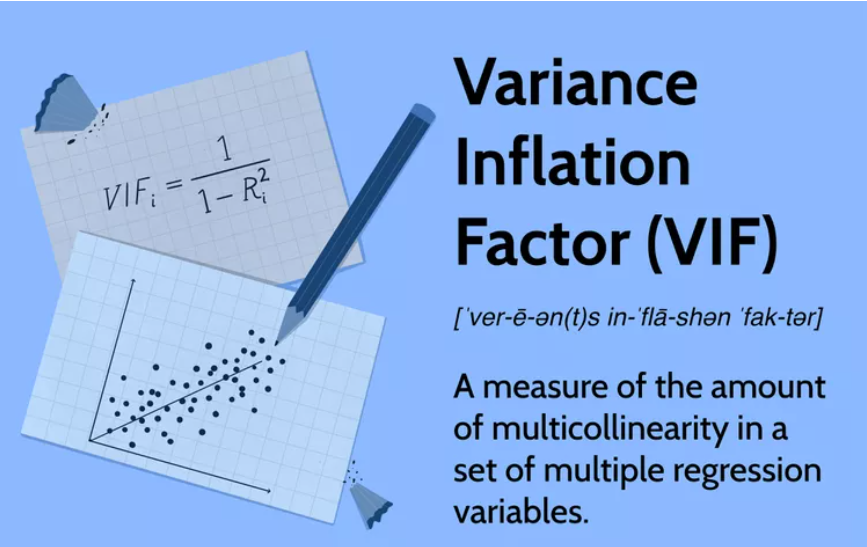
Linear Regression – Assumption – 2 (What Is Variance Inflection Factor?)
What Is Variance Inflection Factor? Table Of Contents: What Is the Variance Inflection Factor? The Problem Of Multicollinearity? Testing For Multicollinearity? Formula For VIF. Interpretation Of VIF. Why Use VIFs Rather Than Pairwise Correlations? Example Of Calculating VIF. (1) What Is Variance Inflection Factor? Variance Inflection Factor is used to measure, how much the variance of the beta estimates has inflected due to multicollinearity issue. A variance inflation factor (VIF) provides a measure of multicollinearity among the independent variables in a multiple regression model. Detecting multicollinearity is important because while multicollinearity does not reduce the explanatory power of the model,
-
Linear Regression – Assumption – 2 (What Is Gauss Markov Theorem?)
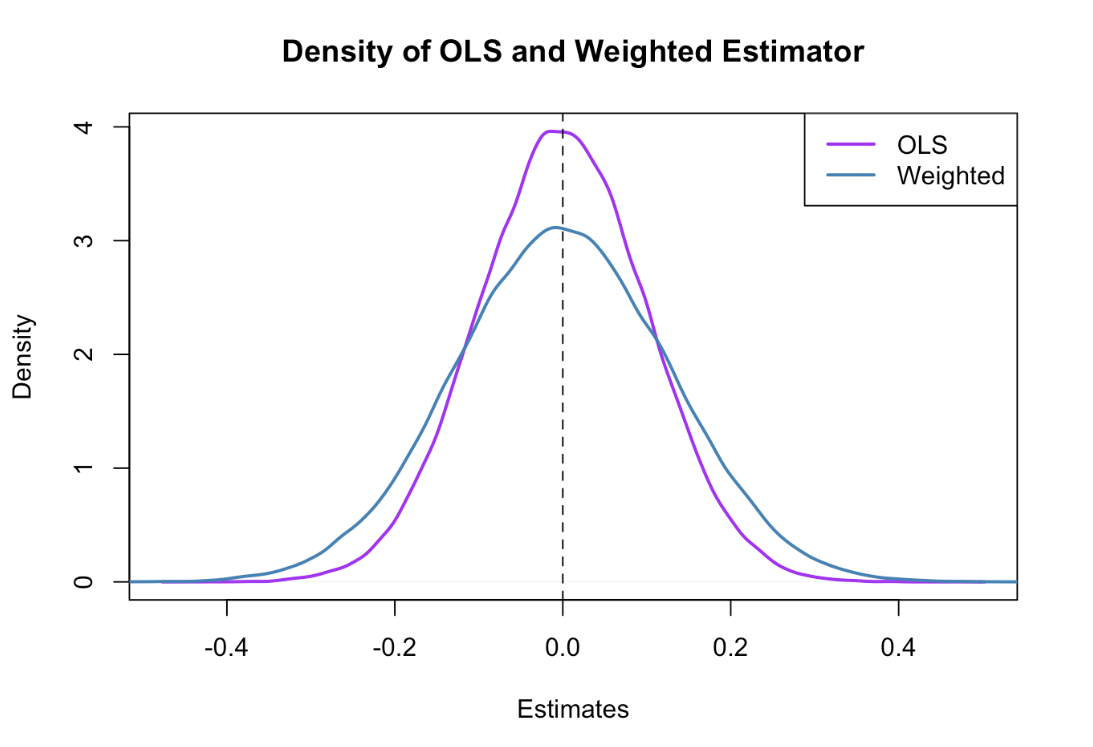
Gauss Markov Theorem Table Of Contents: What Is Gauss Markov Theorem? What Are ‘BLUE’ estimators? What Does OLS Estimates? What Is Sample Distribution Of Parameter Estimates? What Is Unbiased Estimates? Minimum Variance Estimates? Gauss Markov Theorem. (1) What Is Gauss Markov Theorem? The Gauss-Markov theorem states that if your linear regression model satisfies the first six classical assumptions, then ordinary least squares (OLS) regression produces unbiased estimates that have the smallest variance of all possible linear estimators. If our Linear Regression model satisfies the firs six classical assumptions, then the estimators are said to be ‘BLUE’. (2) What Are ‘BLUE’ Estimators? BLUE
-
Linear Regression – Assumption – 2 (Pearson Correlation Coefficient)
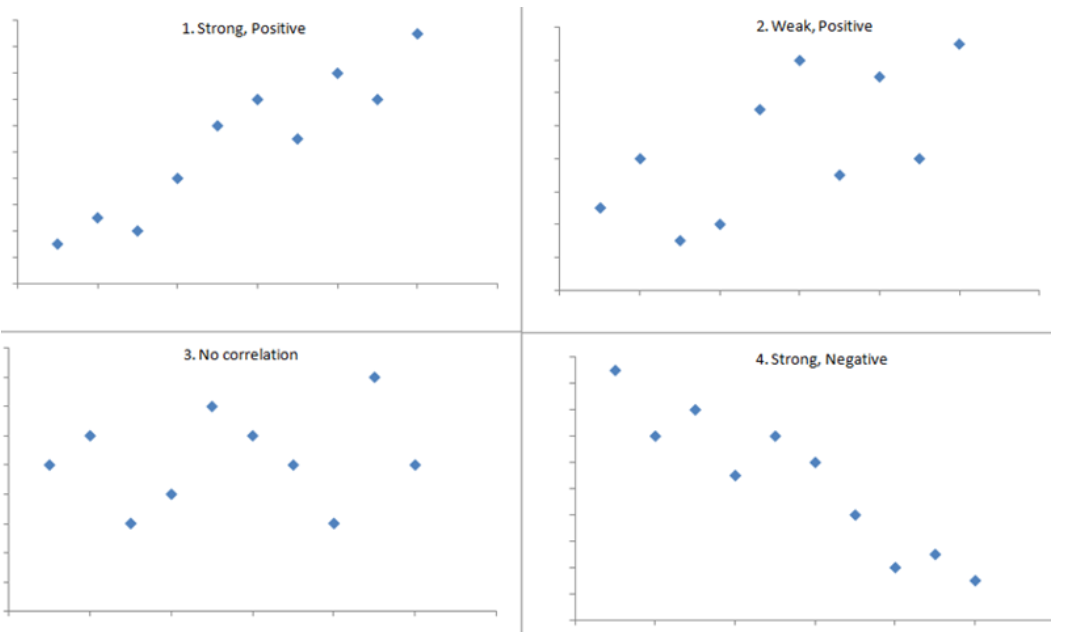
Pearson Correlation Coefficient Table Of Contents: What Is Pearson Correlation Coefficient? Visualizing Pearson Correlation Coefficient. Formula For Pearson Coefficient. Example Of Pearson Coefficient. Difference In Correlation Coefficient and Regression Coefficient. (1) What Is Pearson Correlation Coefficient? The Pearson Correlation Coefficient (r) is the most common way of measuring a linear correlation. It is a number between –1 and 1 that measures the strength and direction of the relationship between two variables. The sample correlation coefficient is denoted as r. Super Note: The Pearson Coefficient can only tell you the is there any linear relationship between two variables or not. If the relationship
-

Assumptions In Linear Regression.
Assumptions In Linear Regression Table Of Contents: What Is A Parametric Model? Assumptions In Linear Regression. (1) What Is A Parametric Model? Regression is a parametric approach. ‘Parametric’ means it makes assumptions about data for the purpose of analysis. Due to its parametric side, regression is restrictive in nature. It fails to deliver good results with data sets that don’t fulfill its assumptions. Therefore, for a successful regression analysis, it’s essential to validate these assumptions. (2) Assumptions Of Linear Regression Model. Linear Relationship Between Input and Output. No Multicollinearity – No Linear Relationship Between Individual Variables. No Autocorrelation Of Error Terms.
-

Linear Regression Algorithm
Linear Regression Algorithm Table Of Contents: What Is Linear Regression? Equation For Linear Regression. Types Of Linear Regression. Linear Regression Line. How To Find The Best Fit Line? Cost Function For Linear Regression. Assumptions In Linear Regression. (1) What Is Linear Regression Model? It’s a Supervised Learning algorithm which goal is to predict continuous, numerical values based on given data input. If you want to mathematically model the behavior of a continuous variable you can use Linear Regression model. First as a Data Scientist you need to find out, what are the factors affecting the continuous variable. Then you can use
