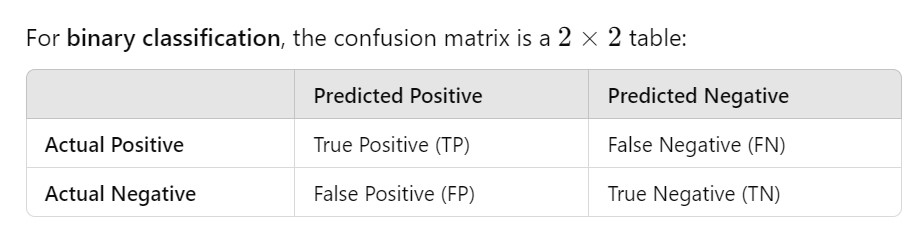
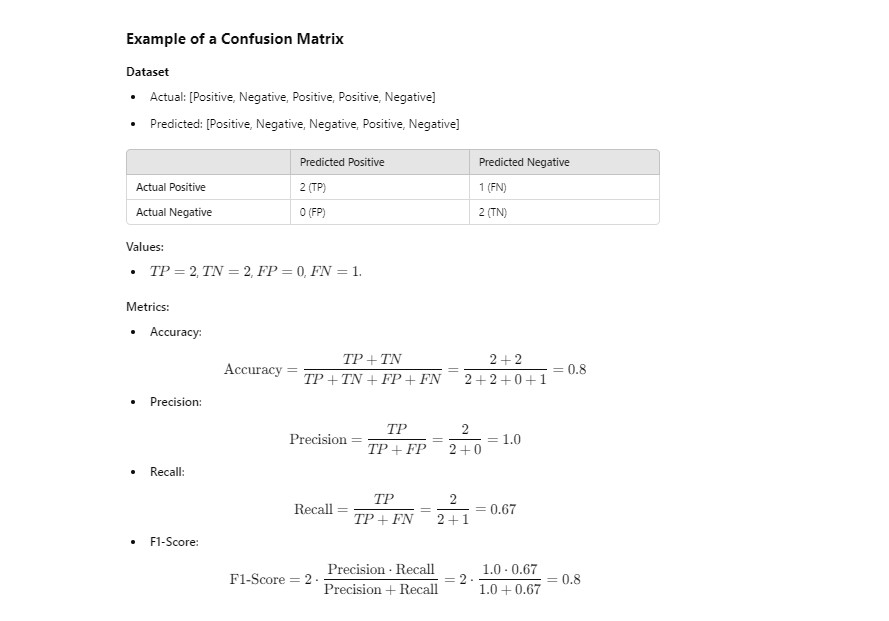
A confusion matrixis a tabular representation of the performance of a classification model.
It helps visualize and understand how well a model’s predictions align with the actual outcomes, especially in binary and multi-class classification.
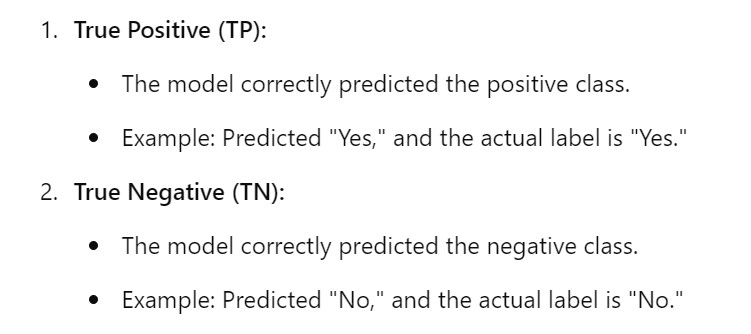
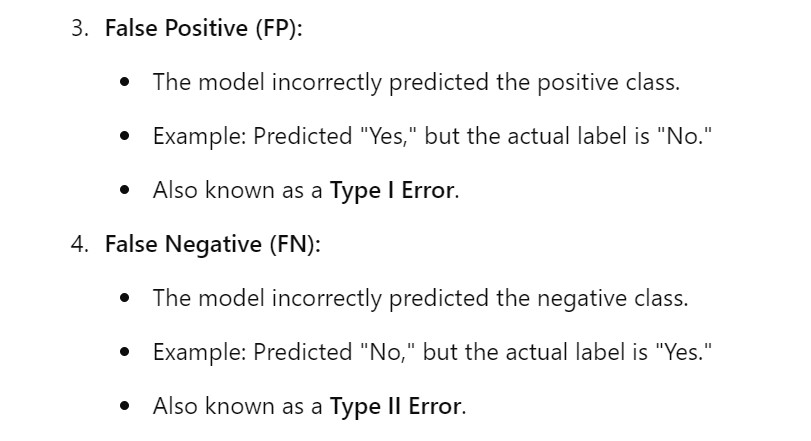
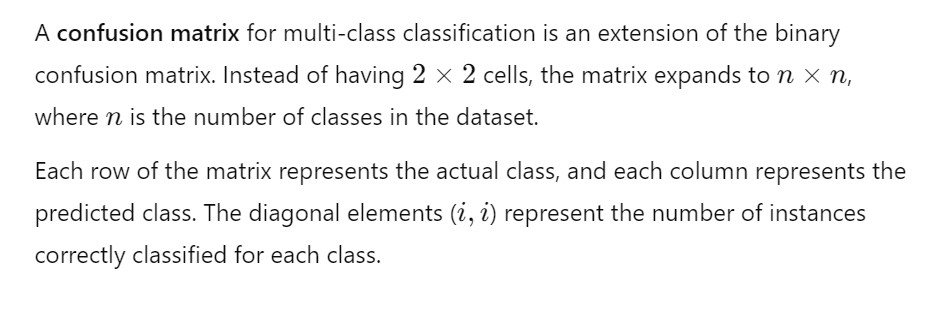
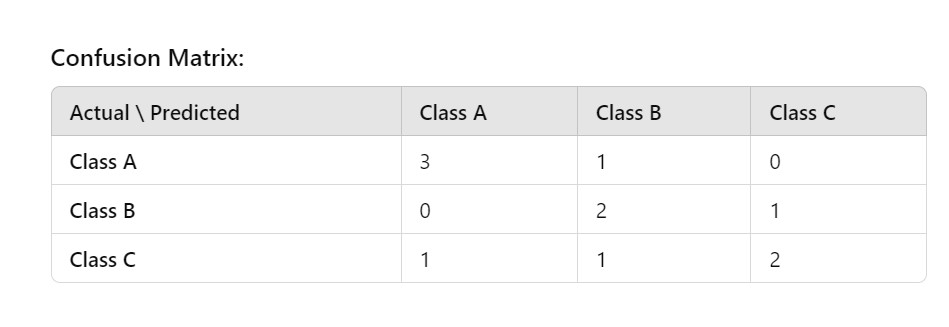
(2) Structure Of Confusion Metrics
Definition:
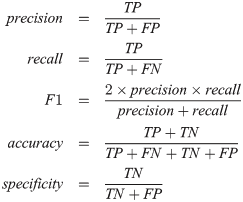
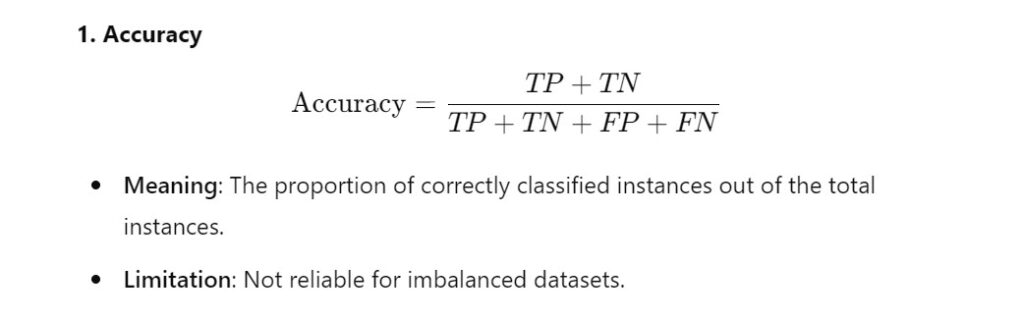
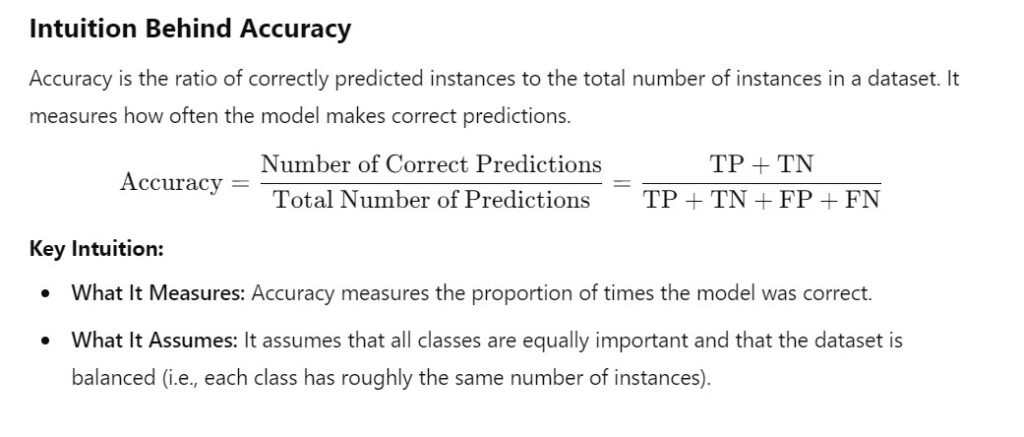
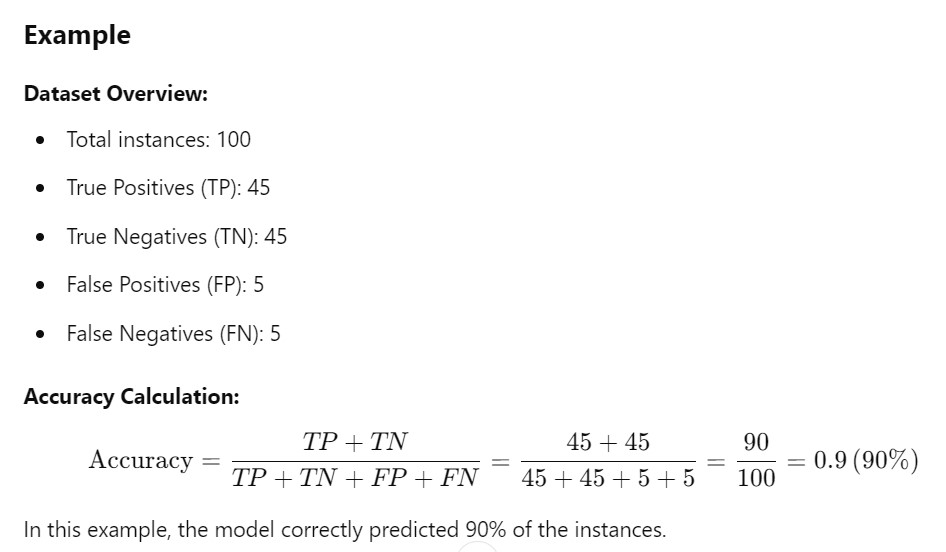
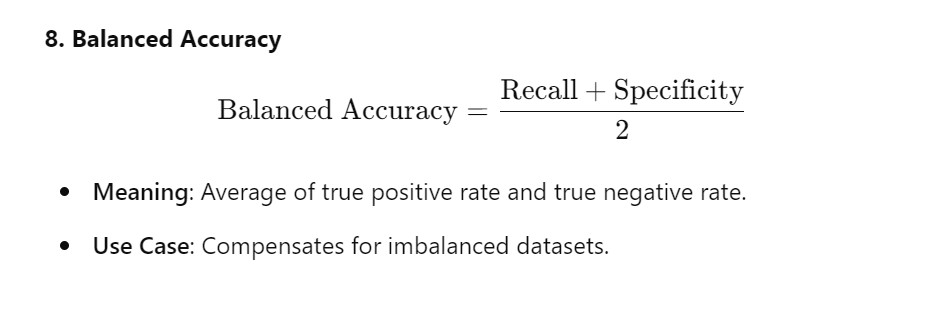
(3) Accuracy
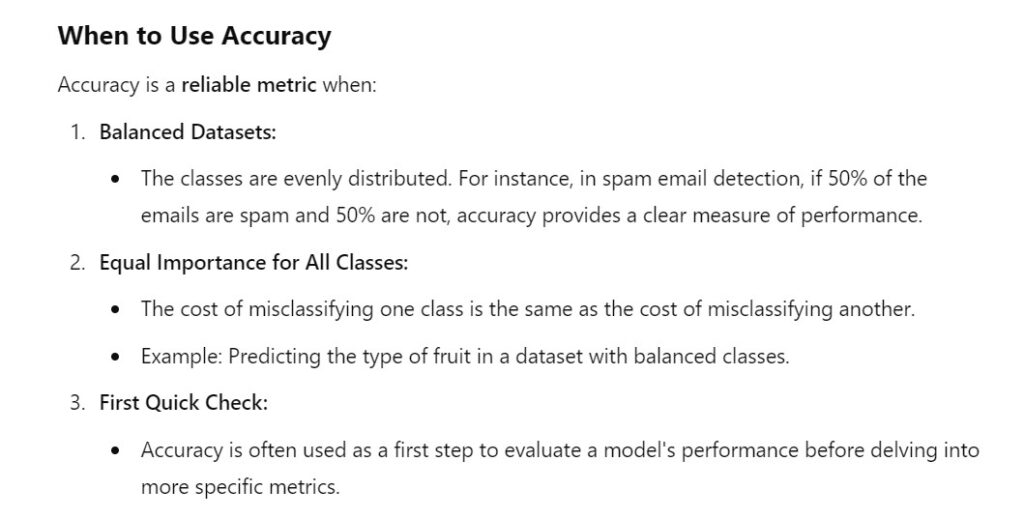
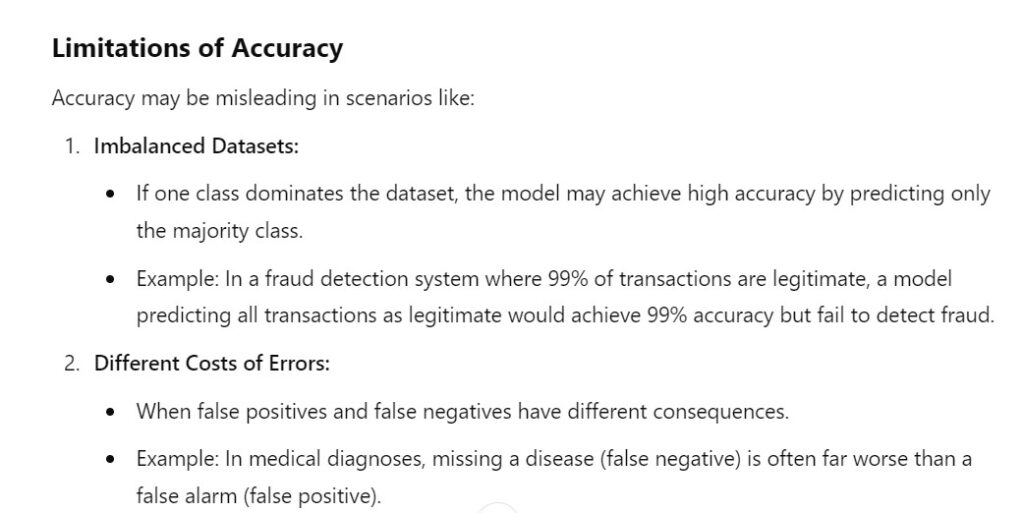
For imbalanced dataset Accuracy will give the wrong impression about the model performance. We can get 95% Accuracy but we have misclassified other classes.
Accuracy gives equal weightage to all the classes, because in the denominator we always divide the total value, whether it is a higher False Positive or higher False Negative the Accuracy does not takes into focus on them.
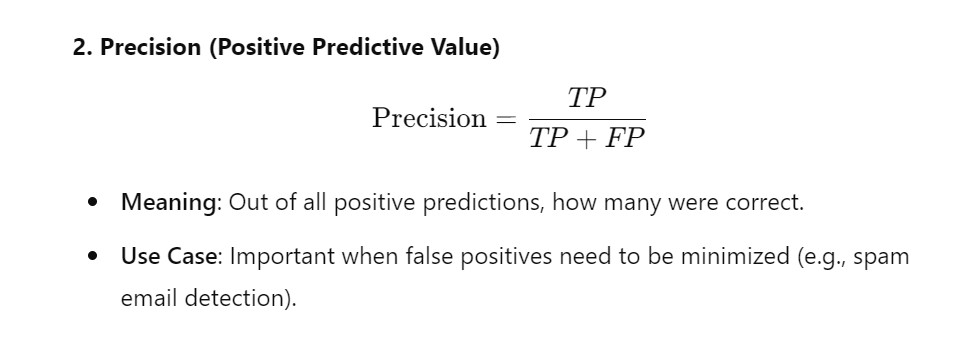
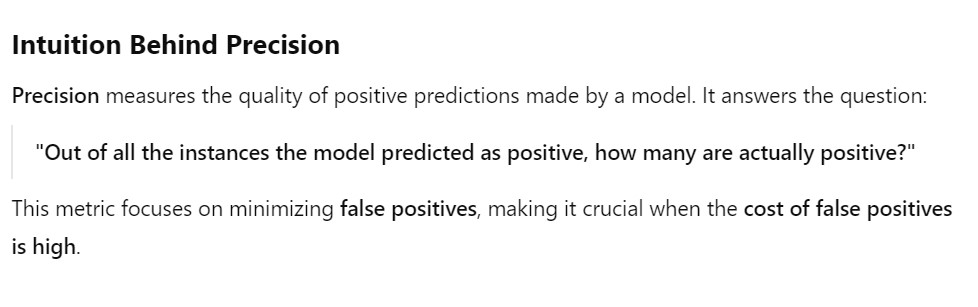
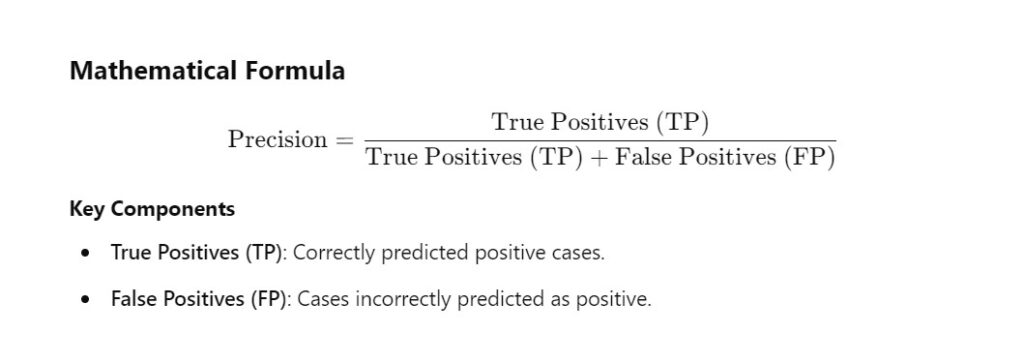
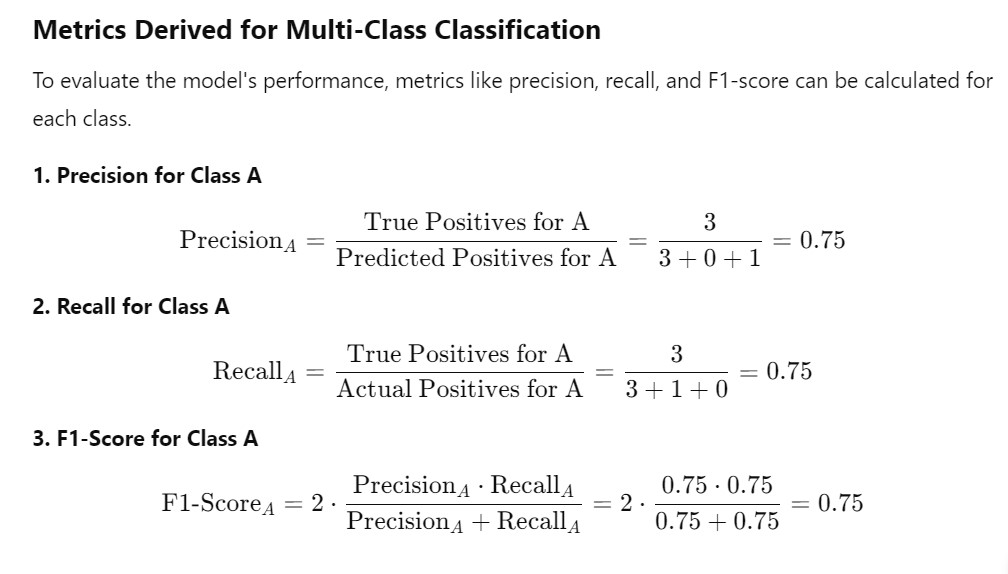
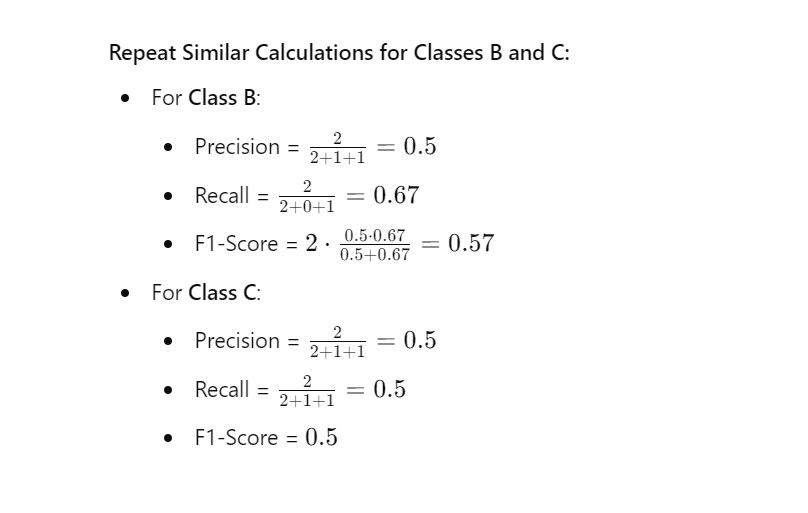
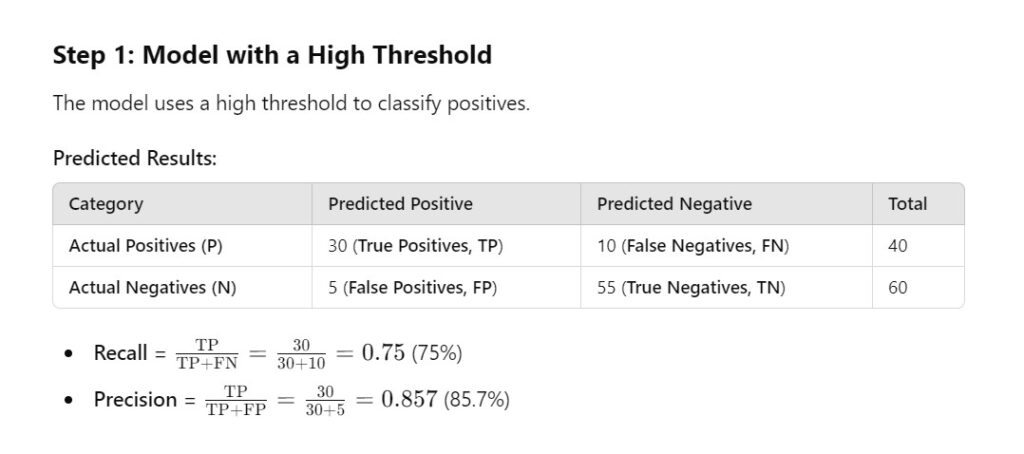
(4) Precision (Positive Predictive Value)
Precision is used when we want to focus on one class of data only.