Data Science – What Is Interpolation ?
Table Of Contents:
- What Is Interpolation ?
- Assumptions Of Interpolation ?
- Linear Interpolation.
- Polynomial Interpolation.
- Spline Interpolation.
(1) What Is Interpolation ?
- Interpolation is a technique used to estimate or “fill in” missing values in a dataset by using the values of surrounding data points.
- In other words, it generates a smooth transition between known values by estimating the unknown values in between.
- This is especially useful in time series or continuous numerical data where missing points can disrupt trends or patterns.
(2) Assumptions Of Interpolation ?
- Interpolation assumes that data points near each other are likely to follow a consistent trend or pattern.
- By using known data points before and after a missing value, we can estimate the missing value based on this pattern.
(3) Linear Interpolation .
- How it works: Fills in missing values by drawing a straight line between two known data points. The missing value is estimated based on its position between these points.
- Example: If you have data points at (1, 10) and (3, 30) with a missing value at (2, ?), linear interpolation will calculate the value at (2) as 20 because it’s halfway between 10 and 30.
- Use case: Simple, ideal for data that follows a roughly linear trend over short gaps.
Example:
import pandas as pd
data['column'] = data['column'].interpolate(method = 'linear')
(4) Polynomial Interpolation .
- How it works: Uses a polynomial equation to fit the known data points and estimates missing values based on the curve.
- Example: Given points at (1, 2), (2, ?), and (3, 10), quadratic interpolation might estimate the missing value at (2) as 5 by fitting a parabola through the points.
- Use case: Useful for non-linear trends, such as exponential growth or curved patterns.
Example:
import pandas as pd
data['column'] = data['column'].interpolate(method='polynomial', order=2)
(5) Spline Interpolation .
- How it works: Fits piecewise polynomials (usually cubic) to the data, ensuring smoothness at the joins.
- Example: Given points at (1,2)(1, 2)(1,2), (2,?)(2, ?)(2,?), and (3,10)(3, 10)(3,10), cubic spline interpolation might estimate the missing value at (2)(2)(2) as 6.56.56.5 by fitting piecewise cubic polynomials through the points while ensuring smoothness at the joins.
- Use case: Ideal for smooth, continuous datasets with non-linear trends.
Example:
import pandas as pd
df['column'] = df['column'].interpolate(method='spline', order=3)
What Is Spline Curve?
- A spline is a mathematical function used to create a smooth curve through a series of data points.
- Instead of fitting a single global polynomial to the entire dataset, splines use piecewise polynomials, which are joined together at specific points called knots.
- These pieces are designed to ensure smoothness and continuity across the entire curve.
Key Characteristics Of Spline Curve.
- Piecewise Polynomial: The curve is defined as separate polynomial segments between knots.
- Smoothness: Splines ensure that the curve is smooth by maintaining continuity in the function and its derivatives (e.g., slope) at the knots.
- Flexibility: Splines can model complex, non-linear relationships without the overfitting issues of high-degree polynomials.
- Types of Splines:
- Linear Spline: A piecewise linear function, creating straight-line segments.
- Quadratic Spline: Uses quadratic polynomials for each segment.
- Cubic Spline: Uses cubic polynomials, the most common type, as it balances smoothness and computational efficiency.
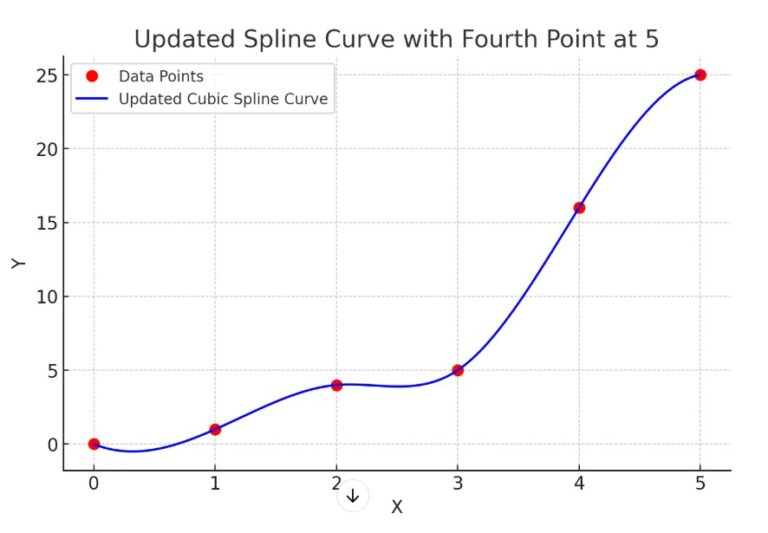
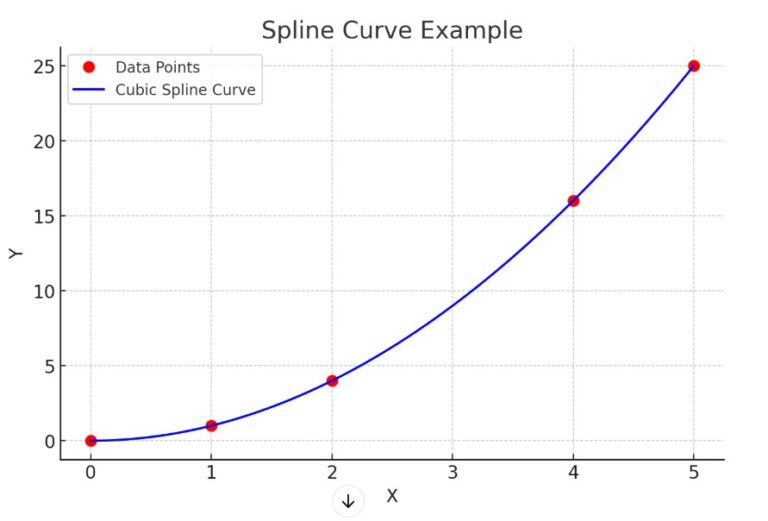
Examples Of Spline Curve.
- what if in the above image the fourth data point is at value = 5 , how the spline curve looks like