from sklearn.datasets import load_iris
from sklearn.tree import DecisionTreeClassifier, export_text
from sklearn.tree import plot_tree
import matplotlib.pyplot as plt
# Load the Iris dataset
iris = load_iris()
X, y = iris.data, iris.target
# Build a decision tree with max_depth=3
clf = DecisionTreeClassifier(max_depth=3, random_state=42)
clf.fit(X, y)
# Plot the decision tree
plt.figure(figsize=(12, 8))
plot_tree(clf, feature_names=iris.feature_names, class_names=iris.target_names, filled=True)
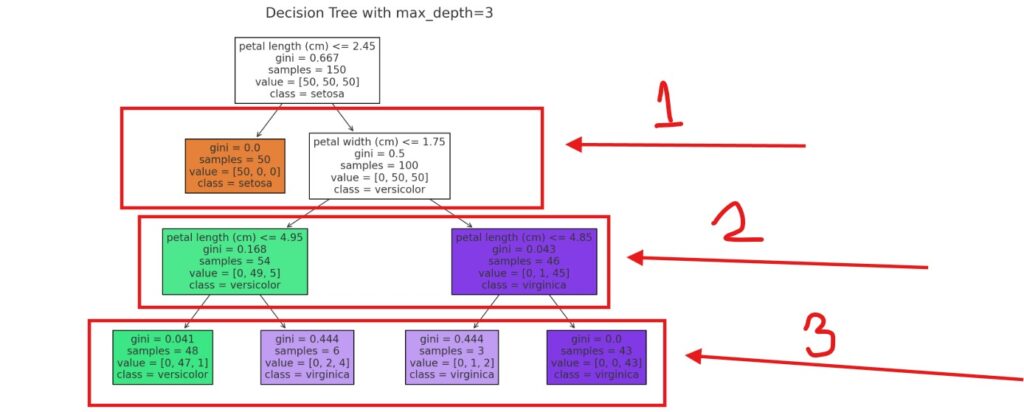
plt.title("Decision Tree with max_depth=3")
plt.show()
# Print the decision tree rules
tree_rules = export_text(clf, feature_names=iris.feature_names)
tree_rules
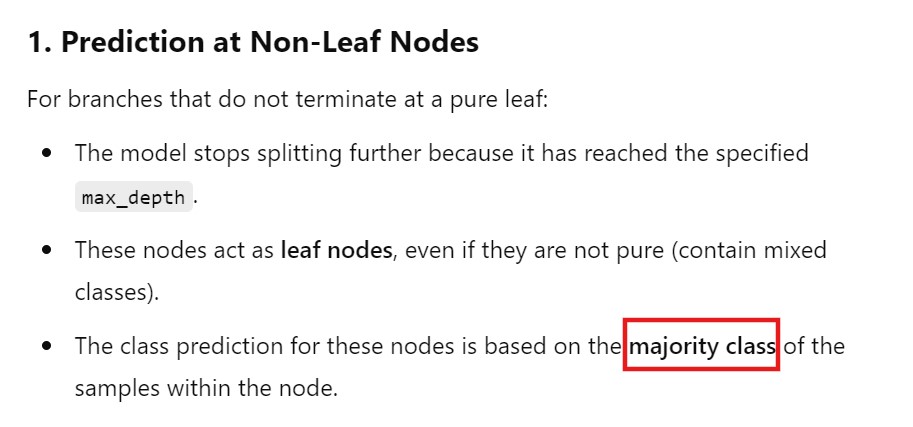
What Will Happen After Setting a MAX_DEPTH the Decision Tree doesnot converges.
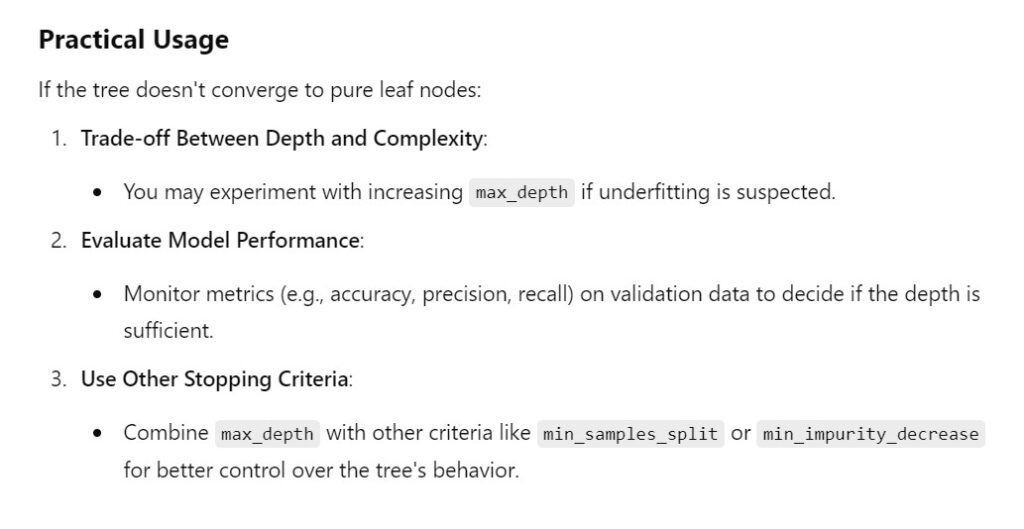
If a decision tree is trained with a specified maximum depth and it does not fully converge to a leaf node for all branches (i.e., the stopping condition is reached before some branches become pure or perfectly classify all samples), the following happens:
(2) Minimum Samples Split (min_samples_split)
# Re-import libraries and reload data
from sklearn.datasets import load_iris
from sklearn.tree import DecisionTreeClassifier, export_text, plot_tree
import matplotlib.pyplot as plt

# Load the Iris dataset
iris = load_iris()
X, y = iris.data, iris.target

# Build a decision tree with min_samples_split=5
clf_min_samples_split = DecisionTreeClassifier(min_samples_split=5, random_state=42)
clf_min_samples_split.fit(X, y)

# Plot the decision tree
plt.figure(figsize=(12, 8))
plot_tree(
    clf_min_samples_split,
    feature_names=iris.feature_names,
    class_names=iris.target_names,
    filled=True
)
plt.title("Decision Tree with min_samples_split=5")
plt.show()

# Print the decision tree rules
tree_rules_split = export_text(clf_min_samples_split, feature_names=iris.feature_names)
tree_rules_split
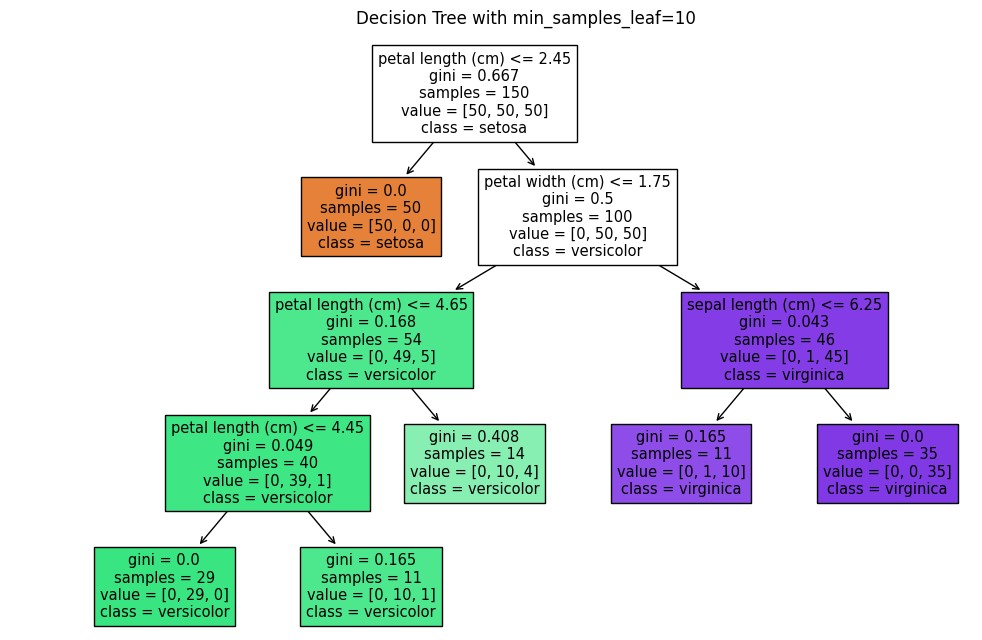
(3) Minimum Samples per Leaf (min_samples_leaf)
from sklearn.datasets import load_iris
from sklearn.tree import DecisionTreeClassifier, plot_tree
import matplotlib.pyplot as plt

# Load Iris dataset
iris = load_iris()
X, y = iris.data, iris.target

# Initialize Decision Tree with min_samples_leaf=10
clf = DecisionTreeClassifier(min_samples_leaf=10, random_state=42)
clf.fit(X, y)

# Plot the decision tree
plt.figure(figsize=(12, 8))
plot_tree(clf, feature_names=iris.feature_names, class_names=iris.target_names, filled=True)
plt.title("Decision Tree with min_samples_leaf=10")
plt.show()
(4) Maximum Features (max_features)
from sklearn.datasets import load_iris
from sklearn.tree import DecisionTreeClassifier, plot_tree
import matplotlib.pyplot as plt

# Load Iris dataset
iris = load_iris()
X, y = iris.data, iris.target

# Initialize Decision Tree with max_features=3
clf = DecisionTreeClassifier(max_features=3, random_state=42)
clf.fit(X, y)

# Plot the decision tree
plt.figure(figsize=(12, 8))
plot_tree(clf, feature_names=iris.feature_names, class_names=iris.target_names, filled=True)
plt.title("Decision Tree with max_features=3")
plt.show()
(5) Maximum Leaf Nodes (max_leaf_nodes)
# Importing necessary libraries
from sklearn.datasets import load_iris
from sklearn.tree import DecisionTreeClassifier, plot_tree
import matplotlib.pyplot as plt

# Load Iris dataset
iris = load_iris()
X, y = iris.data, iris.target

# Initialize Decision Tree with max_leaf_nodes=2
clf = DecisionTreeClassifier(max_leaf_nodes=5, random_state=42)
clf.fit(X, y)

# Plot the decision tree
plt.figure(figsize=(10, 6))
plot_tree(clf, feature_names=iris.feature_names, class_names=iris.target_names, filled=True)
plt.title("Decision Tree with max_leaf_nodes=2")
plt.show()
from sklearn.datasets import load_iris
from sklearn.tree import DecisionTreeClassifier, plot_tree
import matplotlib.pyplot as plt
# Load the Iris dataset
iris = load_iris()
X, y = iris.data, iris.target
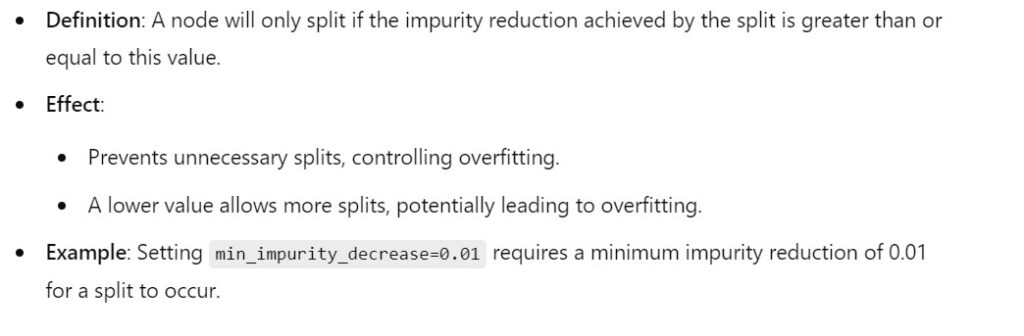
# Initialize Decision Tree with min_impurity_decrease=0.05
clf = DecisionTreeClassifier(min_impurity_decrease=0.05, random_state=42)
clf.fit(X, y)
# Plot the decision tree
plt.figure(figsize=(12, 8))
plot_tree(clf, feature_names=iris.feature_names, class_names=iris.target_names, filled=True)
plt.title("Decision Tree with min_impurity_decrease=0.05")
plt.show()
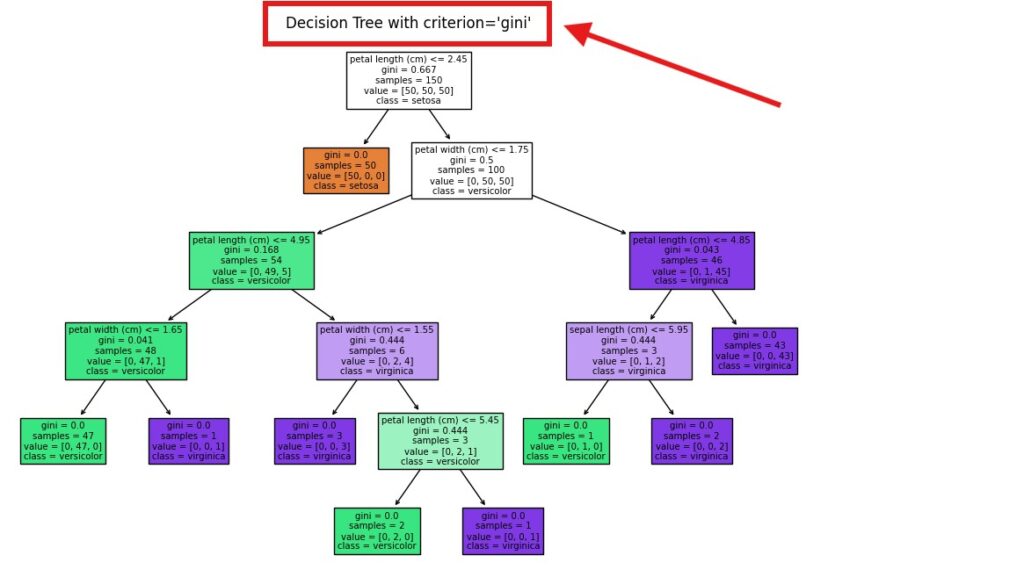
(7) Split Criterion (criterion)
from sklearn.datasets import load_iris
from sklearn.tree import DecisionTreeClassifier, plot_tree
import matplotlib.pyplot as plt

# Load the Iris dataset
iris = load_iris()
X, y = iris.data, iris.target

# Initialize Decision Tree with criterion="gini"
clf_gini = DecisionTreeClassifier(criterion="gini", random_state=42)
clf_gini.fit(X, y)

# Initialize Decision Tree with criterion="entropy"
clf_entropy = DecisionTreeClassifier(criterion="entropy", random_state=42)
clf_entropy.fit(X, y)

# Plot Decision Tree with Gini
plt.figure(figsize=(12, 8))
plot_tree(clf_gini, feature_names=iris.feature_names, class_names=iris.target_names, filled=True)
plt.title("Decision Tree with criterion='gini'")
plt.show()

# Plot Decision Tree with Entropy
plt.figure(figsize=(12, 8))
plot_tree(clf_entropy, feature_names=iris.feature_names, class_names=iris.target_names, filled=True)
plt.title("Decision Tree with criterion='entropy'")
plt.show()
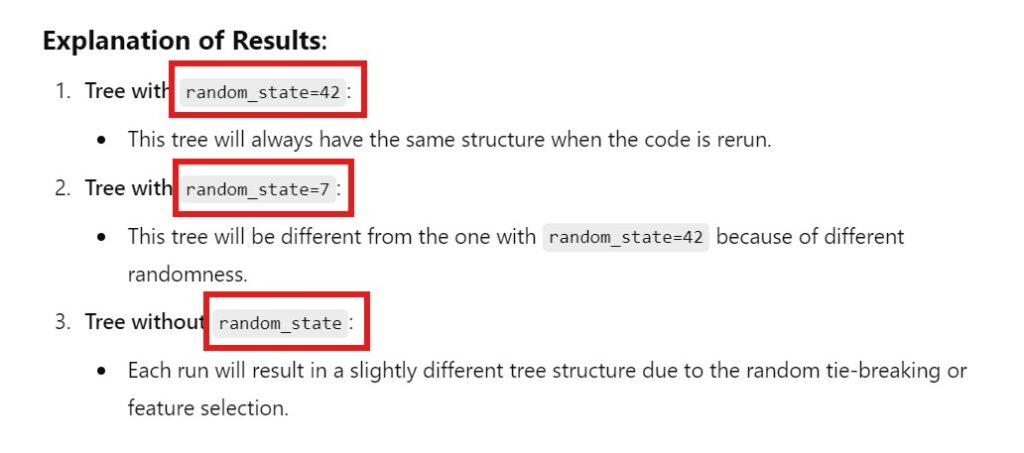
(8) Random State (random_state)
from sklearn.datasets import load_iris
from sklearn.tree import DecisionTreeClassifier, plot_tree
import matplotlib.pyplot as plt

# Load the Iris dataset
iris = load_iris()
X, y = iris.data, iris.target

# Train two decision trees with different random_state values
clf1 = DecisionTreeClassifier(random_state=42)
clf2 = DecisionTreeClassifier(random_state=7)

clf1.fit(X, y)
clf2.fit(X, y)

# Train a tree without setting random_state
clf3 = DecisionTreeClassifier()
clf3.fit(X, y)

# Plot Decision Tree with random_state=42
plt.figure(figsize=(12, 6))
plot_tree(clf1, feature_names=iris.feature_names, class_names=iris.target_names, filled=True)
plt.title("Decision Tree with random_state=42")
plt.show()

# Plot Decision Tree with random_state=7
plt.figure(figsize=(12, 6))
plot_tree(clf2, feature_names=iris.feature_names, class_names=iris.target_names, filled=True)
plt.title("Decision Tree with random_state=7")
plt.show()

# Plot Decision Tree without random_state
plt.figure(figsize=(12, 6))
plot_tree(clf3, feature_names=iris.feature_names, class_names=iris.target_names, filled=True)
plt.title("Decision Tree without random_state")
plt.show()
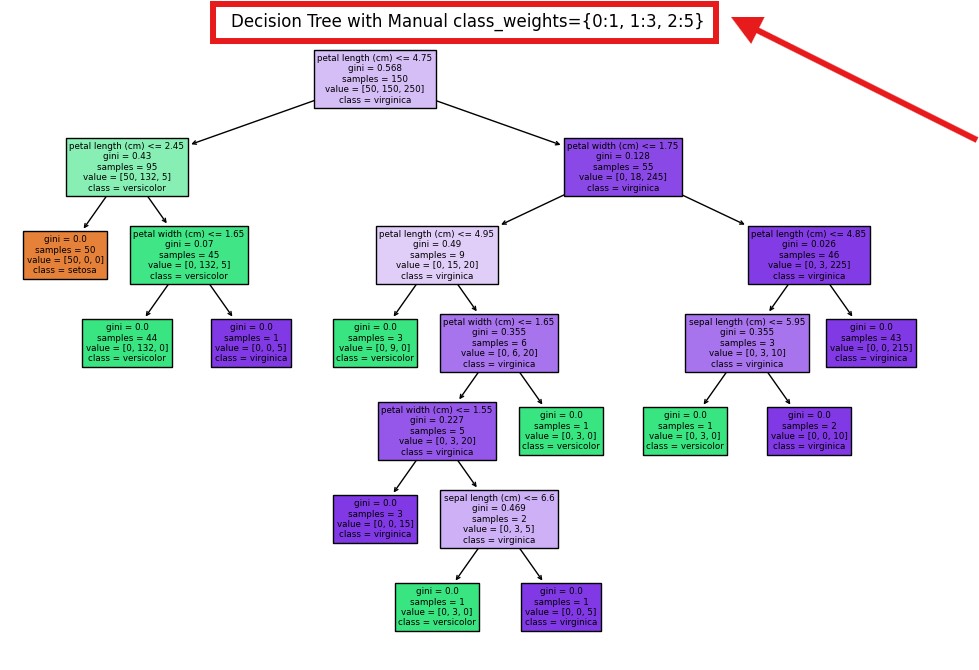
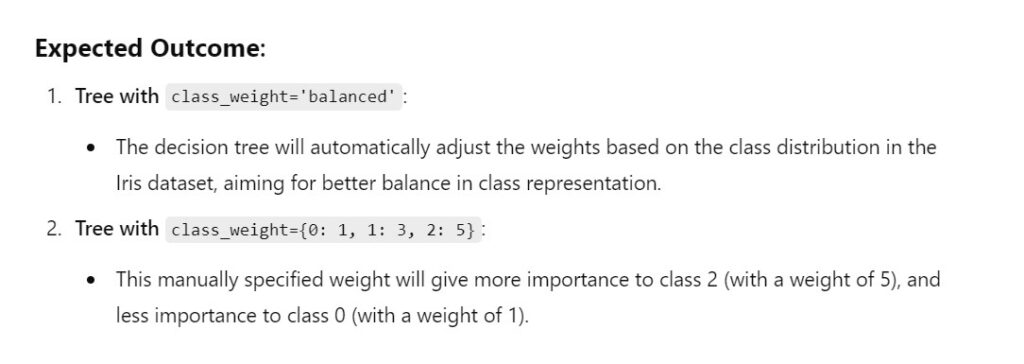
(9) Class Weight (class_weight)
from sklearn.datasets import load_iris
from sklearn.tree import DecisionTreeClassifier, plot_tree
import matplotlib.pyplot as plt

# Load the Iris dataset
iris = load_iris()
X, y = iris.data, iris.target

# Initialize Decision Tree with class_weight='balanced' (automatically adjusts weights)
clf_balanced = DecisionTreeClassifier(class_weight='balanced', random_state=42)
clf_balanced.fit(X, y)

# Plot Decision Tree with class_weight='balanced'
plt.figure(figsize=(12, 8))
plot_tree(clf_balanced, feature_names=iris.feature_names, class_names=iris.target_names, filled=True)
plt.title("Decision Tree with class_weight='balanced'")
plt.show()

# Manually specify class weights (for illustration purposes)
clf_manual = DecisionTreeClassifier(class_weight={0: 1, 1: 3, 2: 5}, random_state=42)
clf_manual.fit(X, y)

# Plot Decision Tree with manual class weights
plt.figure(figsize=(12, 8))
plot_tree(clf_manual, feature_names=iris.feature_names, class_names=iris.target_names, filled=True)
plt.title("Decision Tree with Manual class_weights={0:1, 1:3, 2:5}")
plt.show()
(10) Splitter (splitter)
from sklearn.datasets import load_iris
from sklearn.tree import DecisionTreeClassifier, plot_tree
import matplotlib.pyplot as plt

# Load the Iris dataset
iris = load_iris()
X, y = iris.data, iris.target

# Initialize Decision Tree with splitter='best' (default behavior)
clf_best = DecisionTreeClassifier(splitter='best', random_state=42)
clf_best.fit(X, y)

# Plot the decision tree with 'best' splitter
plt.figure(figsize=(12, 8))
plot_tree(clf_best, feature_names=iris.feature_names, class_names=iris.target_names, filled=True)
plt.title("Decision Tree with splitter='best'")
plt.show()

# Initialize Decision Tree with splitter='random'
clf_random = DecisionTreeClassifier(splitter='random', random_state=42)
clf_random.fit(X, y)

# Plot the decision tree with 'random' splitter
plt.figure(figsize=(12, 8))
plot_tree(clf_random, feature_names=iris.feature_names, class_names=iris.target_names, filled=True)
plt.title("Decision Tree with splitter='random'")
plt.show()