How To Detect & Avoid Autocorrelation In Regression ?
Table Of Contents:
Methods To Detect Autocorrelation In Error Term?
Methods To Avoid The Autocorrelation In Error Term.
(1) Methods To Detect Autocorrelation In Error Term?
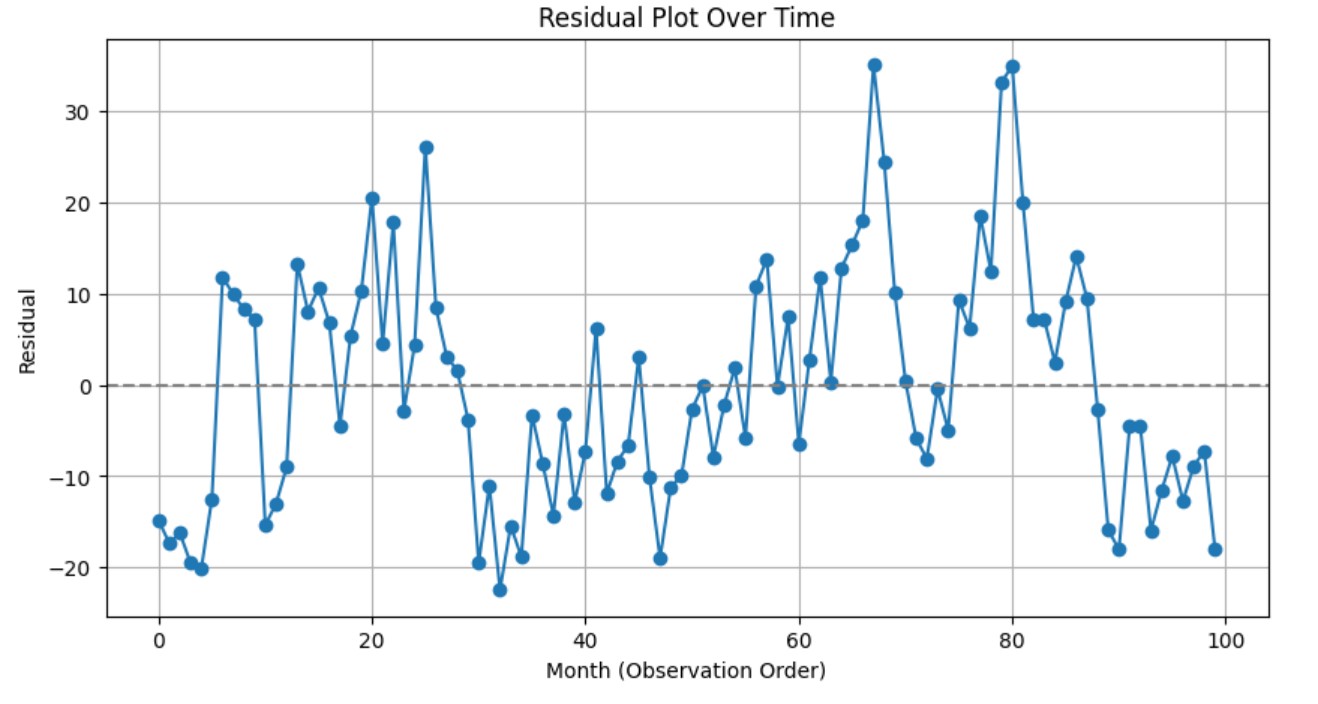
Residual Plot (vs. time or observation order)
Durbin-Watson Test
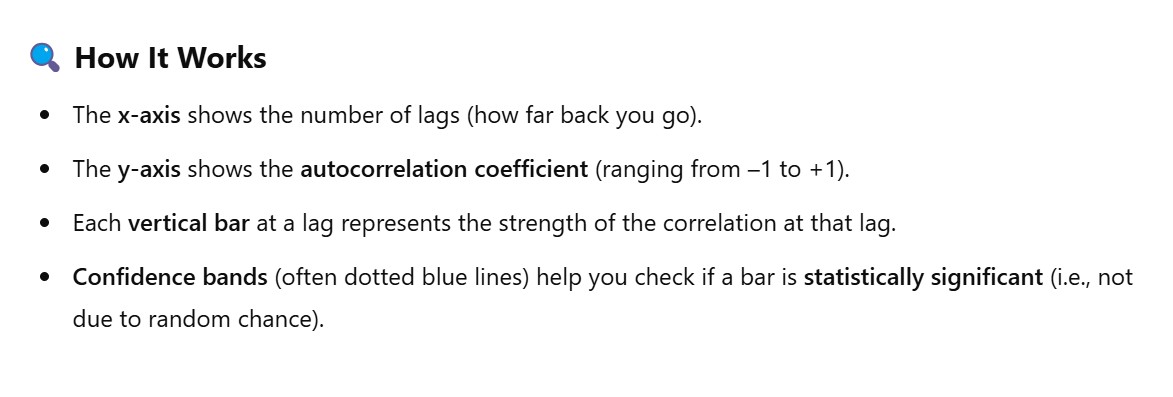
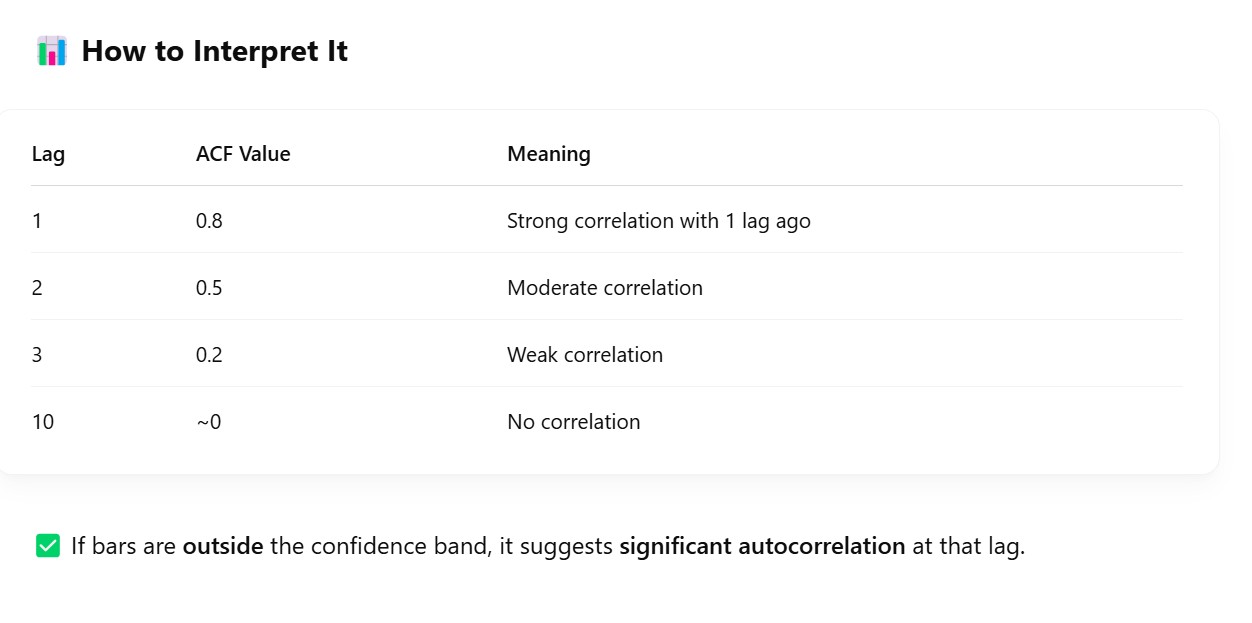
Autocorrelation Function (ACF) Plot
Ljung-Box Test (for multiple lags)
(1.1) Residual Plot To Detect Autocorrelation In Error Term?
import numpy as np
import pandas as pd
import matplotlib.pyplot as plt
import statsmodels.api as sm

# Simulate ordered data (e.g., time series)
np.random.seed(42)
n = 100
advertising = np.random.normal(1000, 200, n)

# Introduce autocorrelation in error terms
errors = np.zeros(n)
rho = 0.8  # autocorrelation factor
errors[0] = np.random.normal(0, 10)
for i in range(1, n):
    errors[i] = rho * errors[i - 1] + np.random.normal(0, 10)

# Generate sales (dependent variable)
sales = 50 + 0.5 * advertising + errors

# Fit a linear regression model
X = sm.add_constant(advertising)
model = sm.OLS(sales, X).fit()
residuals = model.resid

# 📈 Plot residuals over time
plt.figure(figsize=(10, 5))
plt.plot(residuals, marker='o')
plt.title("Residual Plot Over Time")
plt.xlabel("Month (Observation Order)")
plt.ylabel("Residual")
plt.axhline(0, linestyle="--", color="gray")
plt.grid(True)
plt.show()
(1.2) Durbin-Watson Test To Detect Autocorrelation In Error Term?
import pandas as pd
import statsmodels.api as sm
from statsmodels.stats.stattools import durbin_watson
import seaborn as sns

# Load or simulate time series data
df = sns.load_dataset("flights")  # Just for example
df = df.rename(columns={"passengers": "sales"})
df["month_id"] = range(len(df))
X = sm.add_constant(df["month_id"])
y = df["sales"]

# Fit linear regression model
model = sm.OLS(y, X).fit()

# Get residuals
residuals = model.resid

# Durbin-Watson Test
dw_stat = durbin_watson(residuals)
print(f"Durbin-Watson Statistic: {dw_stat:.4f}")
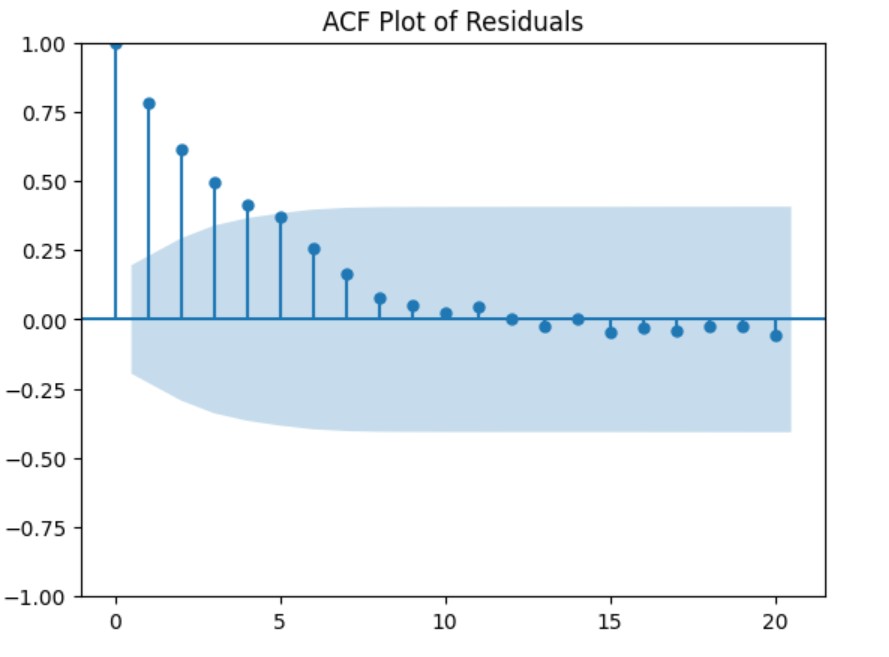
(1.3) Autocorrelation Function (ACF) Plot
import numpy as np
import pandas as pd
import matplotlib.pyplot as plt
from statsmodels.graphics.tsaplots import plot_acf

# Set seed for reproducibility
np.random.seed(42)

# Create autocorrelated residuals (AR(1) process)
n = 100
residuals = [0]
for t in range(1, n):
    residuals.append(0.8 * residuals[t-1] + np.random.normal())

residuals = np.array(residuals)

# Plot residuals
plt.figure(figsize=(10, 4))
plt.plot(residuals, label='Residuals')
plt.title("Autocorrelated Residuals")
plt.xlabel("Time")
plt.ylabel("Residual")
plt.grid(True)
plt.legend()
plt.show()

# Plot ACF
plot_acf(residuals, lags=20)
plt.title("ACF Plot of Residuals")
plt.show()
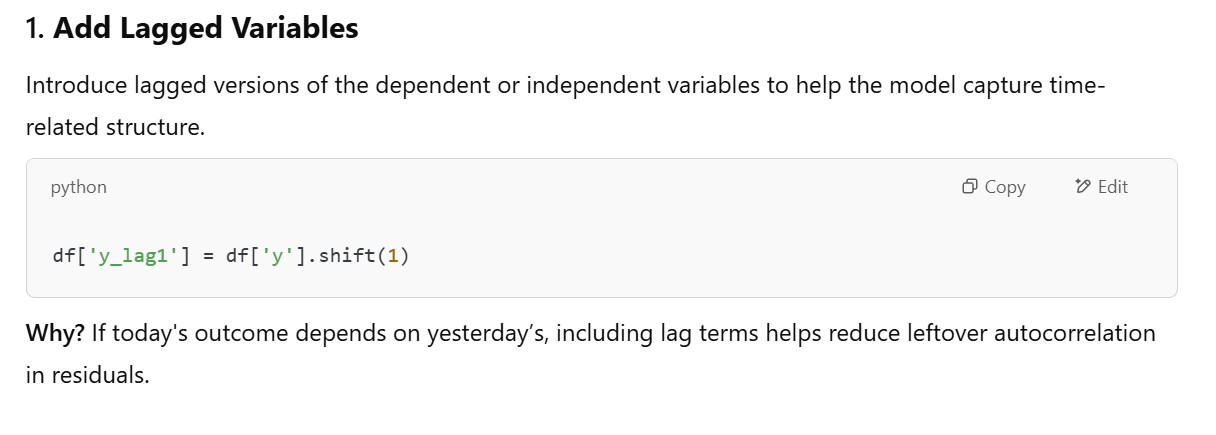
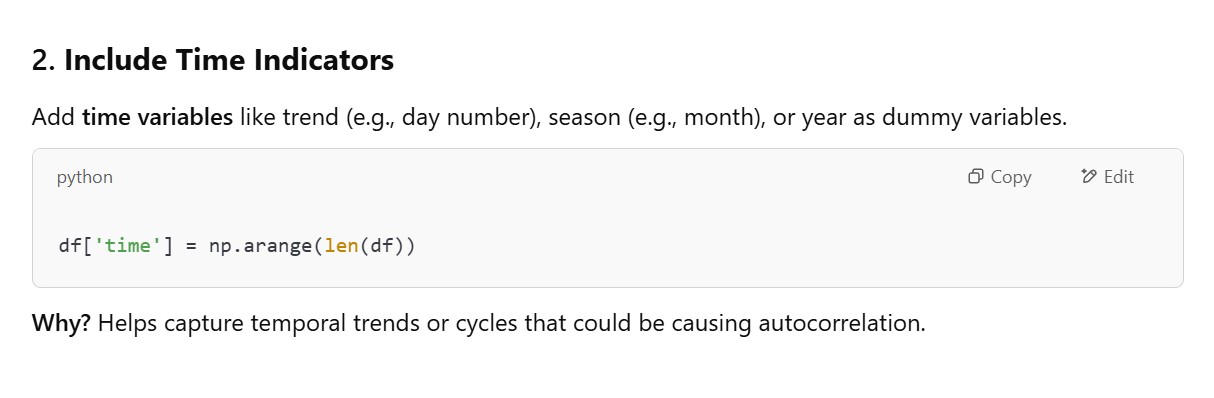
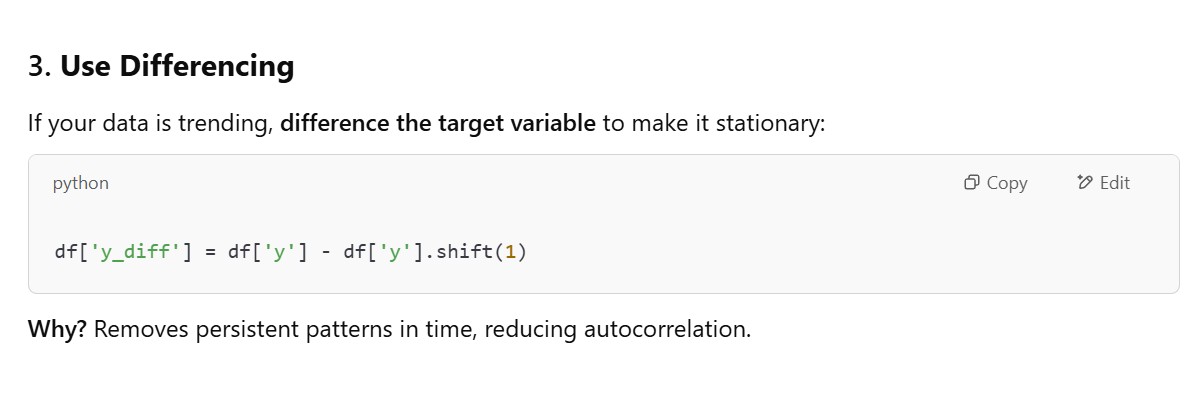
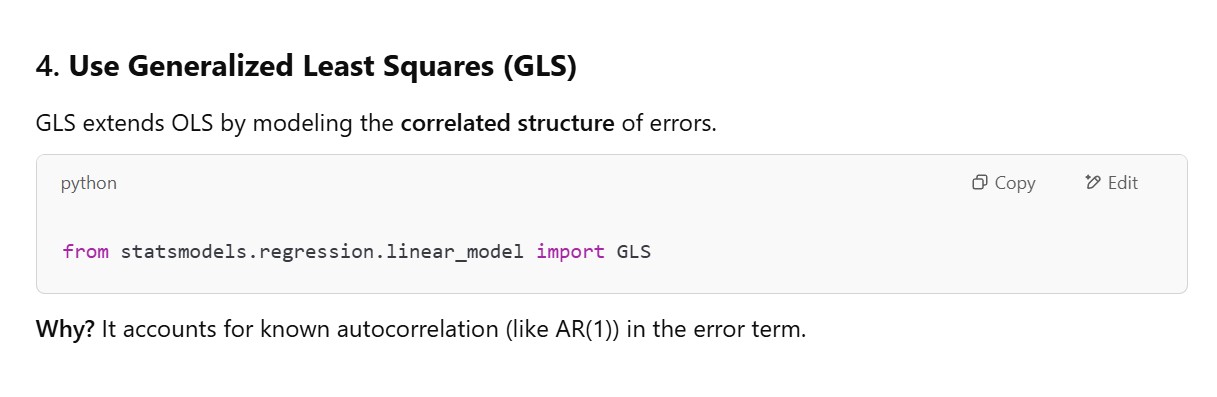
(2) Methods To Avoid Autocorrelation In Error Term?