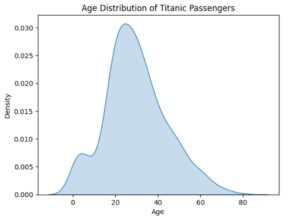
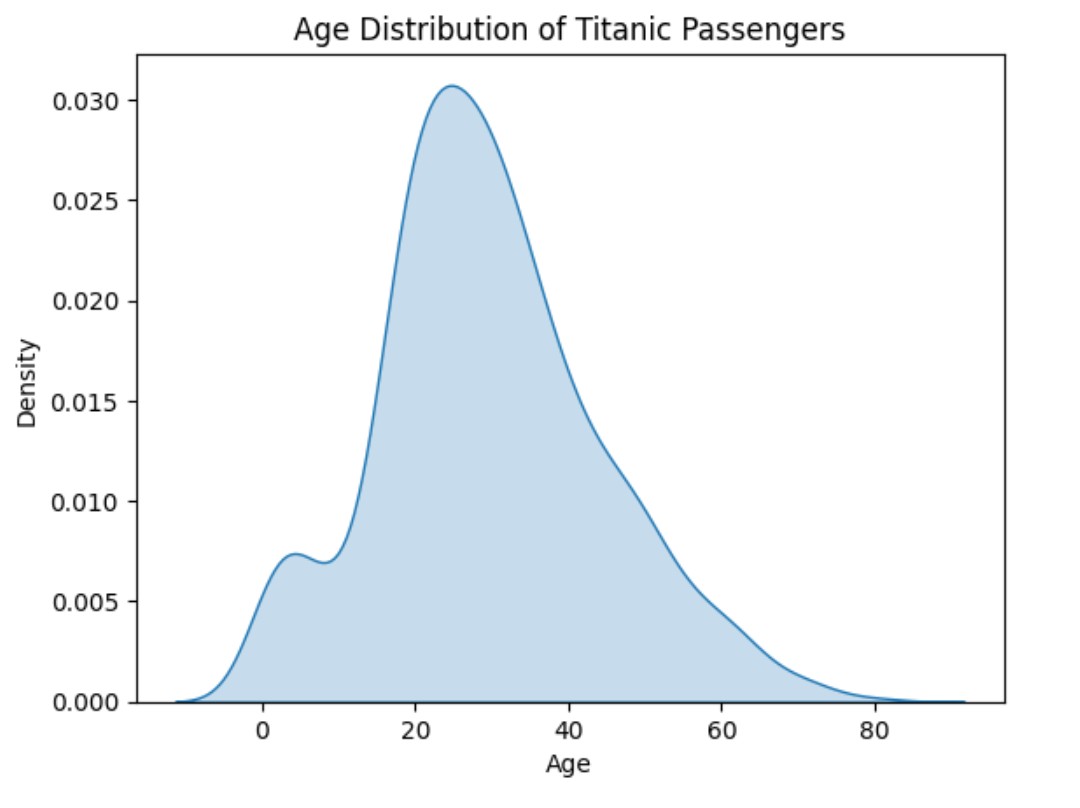
import seaborn as sns
import matplotlib.pyplot as plt

# Load the Titanic dataset
titanic = sns.load_dataset("titanic")

# Create KDE plot for age
sns.kdeplot(data=titanic, x="age", fill=True)

# Add labels and title
plt.xlabel("Age")
plt.ylabel("Density")
plt.title("Age Distribution of Titanic Passengers")

# Show the plot
plt.show()
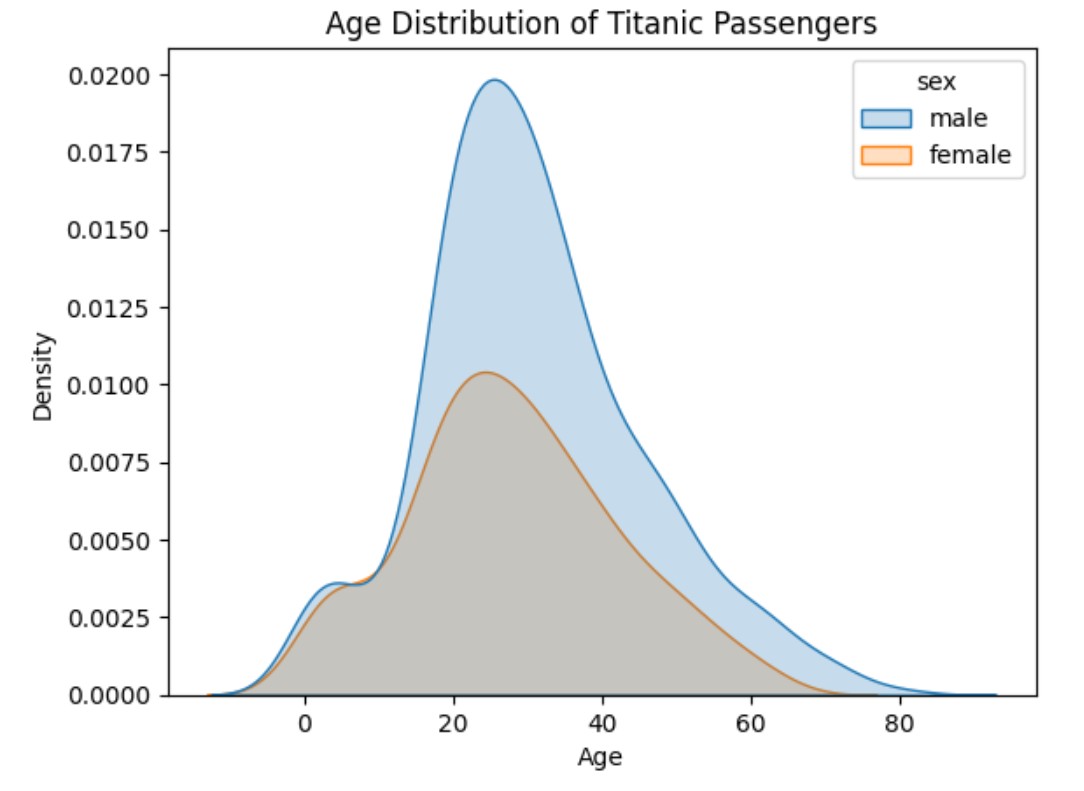
Example-2: Age Distribution By Gender
import seaborn as sns
import matplotlib.pyplot as plt

# Load the Titanic dataset
titanic = sns.load_dataset("titanic")

# Create KDE plot for age
sns.kdeplot(data=titanic, x="age", hue = 'sex', fill=True)

# Add labels and title
plt.xlabel("Age")
plt.ylabel("Density")
plt.title("Age Distribution of Titanic Passengers")

# Show the plot
plt.show()