-
Seaborn – Bar Plot Visualization
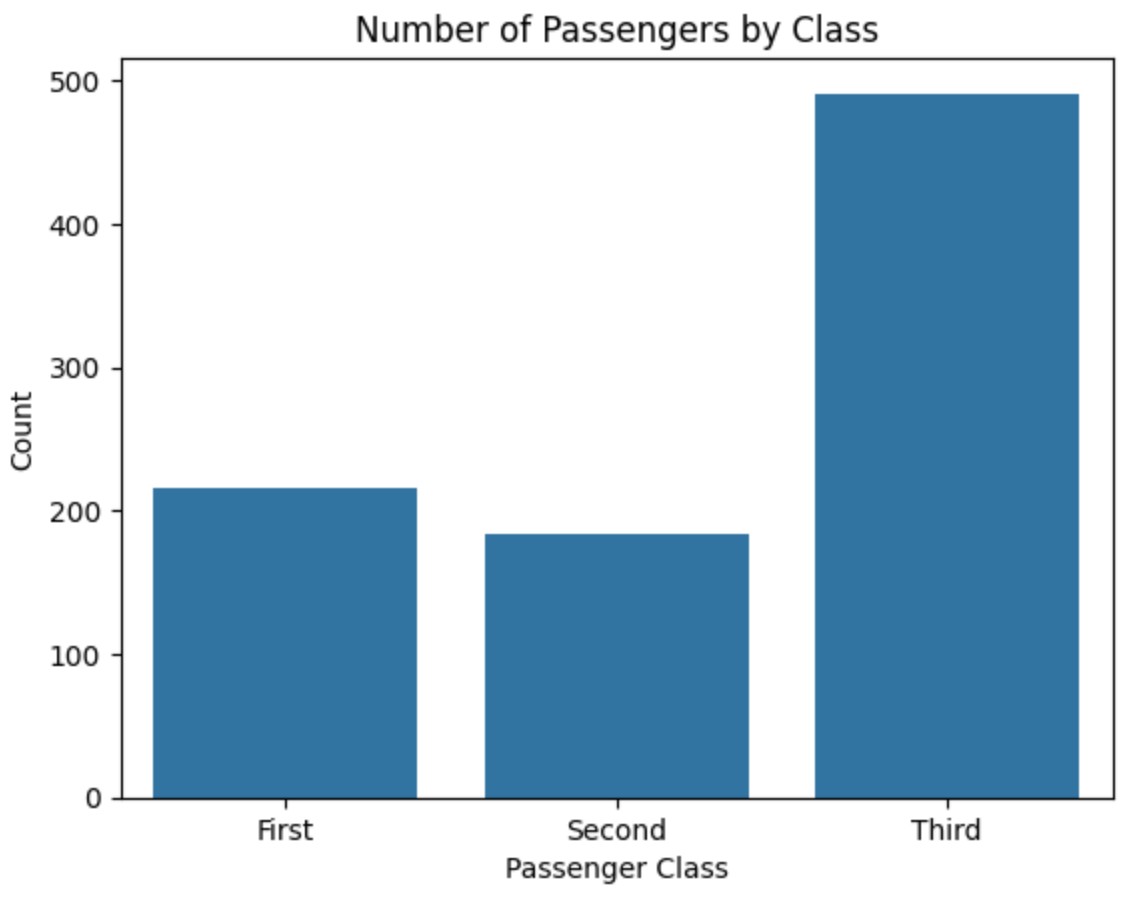
Seaborn – Bar Plot Visualization Table Of Contents: What Is Bar Plot ? Where To Use Bar Plot ? Examples Of Bar Plot ? (1) What Is Bar Plot ? Note : The Bar Plot mainly used to summarize the categorical variable. (2) Where to Use a Bar Plot ? (3) Example Of Bar Plot ? Example-1: Titanic Passenger Class Vs Count. import seaborn as sns import matplotlib.pyplot as plt # Load dataset titanic = sns.load_dataset("titanic") # Create Bar Plot (Count of passengers by class) sns.barplot(x=titanic["class"].value_counts().index, y=titanic["class"].value_counts().values) plt.title("Number of Passengers by Class") plt.xlabel("Passenger Class") plt.ylabel("Count") plt.show() Example-2: Bar PLOT With
