-
Seaborn – Heatmap Plot Visualization
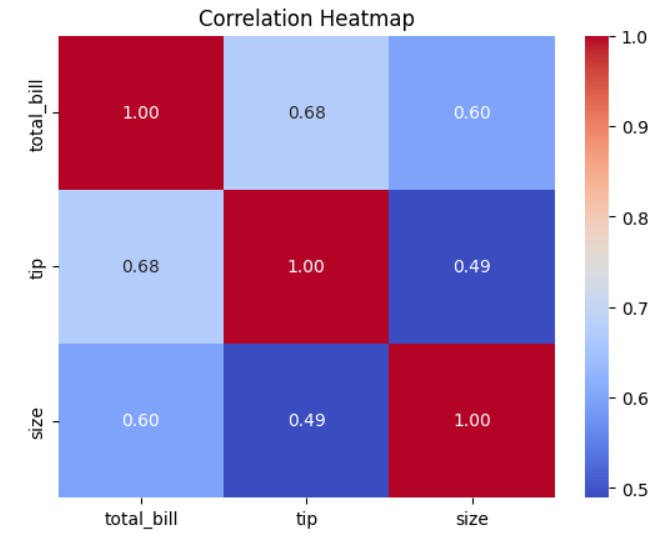
Seaborn – Heatmap Plot Visualization Table Of Contents: What Is Heatmap Plot ? Where To Use Heatmap Plot ? Examples Of Heatmap Plot ? (1) What Is Heatmap Plot ? (2) Where To Use Heatmap Plot ? (3) Examples Of Heatmap Plot ? Example-1: Basic Heatmap for Correlation Matrix import seaborn as sns import matplotlib.pyplot as plt # Load built-in dataset tips = sns.load_dataset("tips") # Keep only numeric columns tips_numeric = tips.select_dtypes(include="number") # Compute correlation matrix corr = tips_numeric.corr() # Create heatmap sns.heatmap(corr, annot=True, cmap="coolwarm", fmt=".2f") plt.title("Correlation Heatmap") plt.show() Example-2: Heatmap for Missing Values import numpy as np import pandas
