-
Seaborn – Joint Plot Visualization
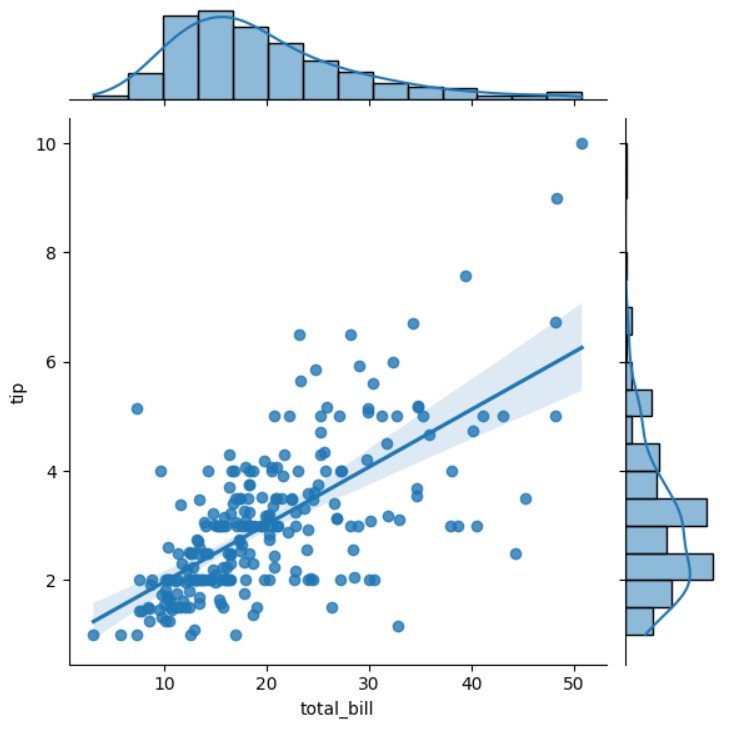
Seaborn – Joint Plot Visualization Table Of Contents: What Is Joint Plot ? Where To Use Joint Plot ? Examples Of Joint Plot ? (1) What Is Joint Plot ? (2) Where to Use a Joint Plot? (3) Examples Of Joint Plot ? Example-1: Basic Joint Plot import seaborn as sns import matplotlib.pyplot as plt # Load built-in tips dataset tips = sns.load_dataset("tips") # Create a joint plot sns.jointplot(data=tips, x="total_bill", y="tip") plt.show() Example-2: Joint Plot with Regression Line (Kind=”reg”) import seaborn as sns import matplotlib.pyplot as plt # Load built-in tips dataset tips = sns.load_dataset("tips") # Create a joint plot
