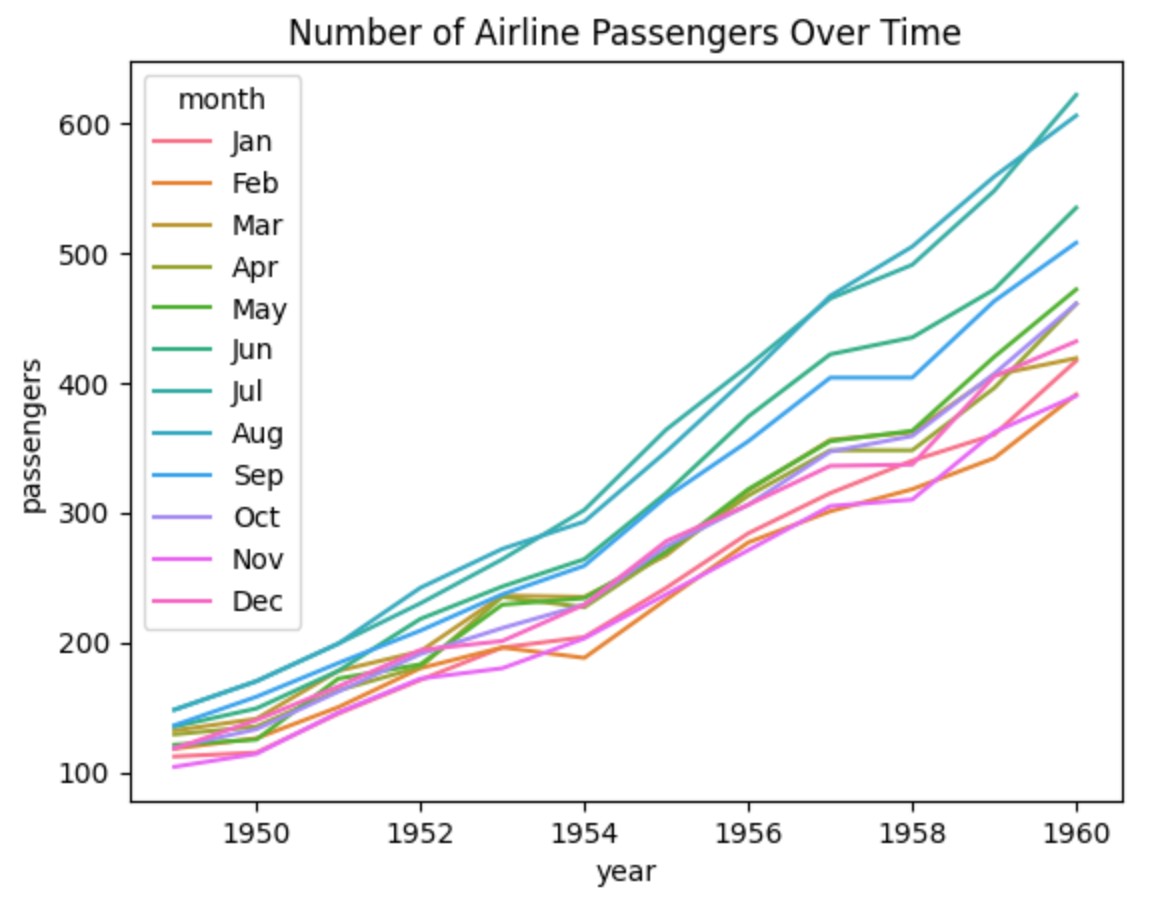
-

Seaborn – Line Plot Visualization
Seaborn – Line Plot Visualization Table Of Contents: What Is Line Plot? Example Of Line Plot. (1) What Is Line Plot ? A line plot is a type of graph that shows how something changes over time or along a continuous variable. It connects data points with a line to show trends and patterns. Example-1: Basic Line Plot import seaborn as sns import matplotlib.pyplot as plt # Sample Data data = { "year": [2015, 2016, 2017, 2018, 2019, 2020, 2021], "sales": [50, 55, 60, 80, 90, 100, 120] } # Create the plot sns.lineplot(x=data["year"], y=data["sales"]) # Show the plot plt.title("Sales
