-
Interpretation Of Logistic Regression Coefficients.
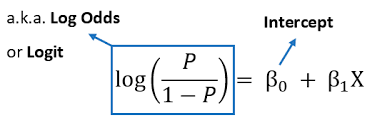
Interpretation Of Logistic Regression Coefficients. Table Of Contents: Understanding Logistic Regression Model. What Is Odd Ratio? What Is Log Odd Ratio? Examples Of Coefficients Interpretation. From Log Odds To Probability. Interpreting Coefficients. Examples Of Interpreting Coefficients. Interpreting Standard Error. How To Interpret Intercept? Odd Ratio Interpretation. More Reading Links. (1) Understanding Logistic Regression Model. Here’s what a Logistic Regression model looks like: You notice that it’s slightly different from a linear model. Let’s clarify each bit of it. logit(p) is just a shortcut for log(p/1-p), where p = P{Y = 1}, i.e. the probability of “success”, or the presence of an outcome. X₁
-

Maximum Likelihood Vs. Cost Function.
Maximum Likelihood Vs. Cost Function. Table Of Contents: What Is Maximum Likelihood? What Is Cost Function? Which One To Use Where? (1) What Is Maximum Likelihood Function? The likelihood function, denoted as L(θ | x), measures the probability of observing the given data (x) for different values of the model parameters (θ). It is a fundamental concept in statistical inference, particularly in cases where we want to estimate the parameters of a statistical model based on observed data. The likelihood function is constructed based on the assumption that the observed data points are independent and identically distributed (i.i.d.) and follow
-
What Is Likelihood In Statistics?
What Is Likelihood In Statistics? Table Of Contents: What Is Likelihood? What Is Likelihood Function? (1) What Is Likelihood? Probability in statistics tells us about, what is the percentage of chance that the event is going to happen, give we should know the distribution of the data points, like normal distribution, exponential distribution etc. Likelihood in statistics tells us that, given all the data points we need to find out which distribution the data points are falling into. Here our main focus is to find out the distribution estimates like, the mean and standard deviation of the population. In Likelihood
-
Logistic Regression.
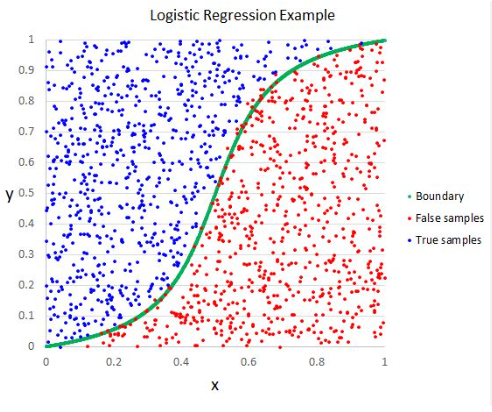
Logistic Regression Table Of Contents: What Is Logistic Regression? Types Of Logistic Regression. Why do we use Logistic regression rather than Linear Regression? Logistic Function. How Logistic Regression Maps Linear Regression Output? Cost Function In Logistic Regression. Likelihood Function For Logistic Regression. Gradient Descent Optimization. Assumptions Of Logistic Regression. (1) What Is Logistic Regression? Logistic Regression is a supervised machine learning algorithm mainly used for classification tasks. Where the goal is to predict the probability that an instance of belonging to a given class. It is commonly used when the dependent variable is categorical and takes on two possible outcomes, often referred
-
Linear Regression – What Is a Biased Estimator In Linear Regression?
What Is a Biased Estimator In Linear Regression? In linear regression, estimator biasness refers to the systematic deviation of the estimated coefficients from their true population values. A biased estimator consistently produces estimates that, on average, differ from the true values in a predictable manner. In the context of linear regression, the biases of an estimator can occur for different reasons: Omitted Variable Bias: If relevant variables are excluded from the regression model, the estimated coefficients may be biased. Omitted variable bias arises when the omitted variables are correlated with both the independent variables included in the model and the
-
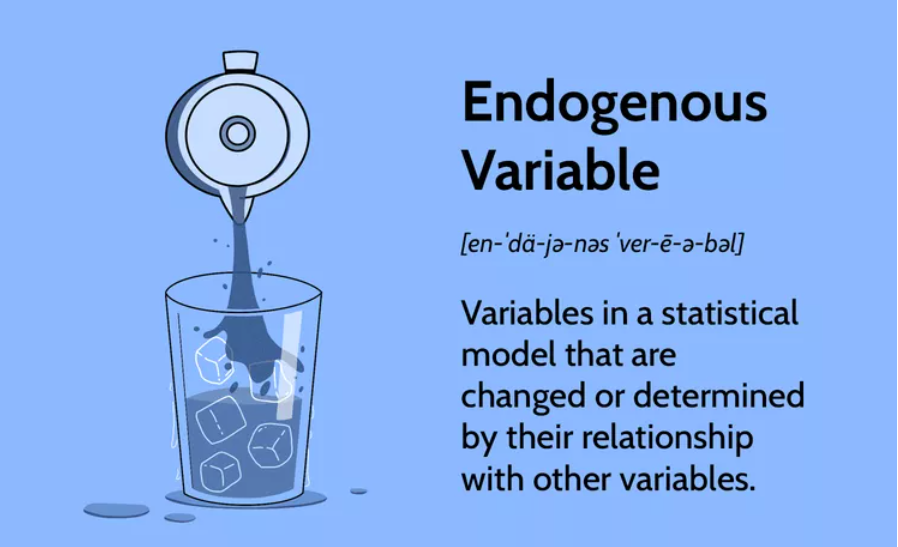
Linear Regression – Assumption – 6 (What Is Endogeneity?)
What Is Endogeneity Table Of Contents: What Is Endogeneity? Why Does Endogeneity occur? How To Avoid Endogeneity? (1) What Is Endogeneity? Endogeneity refers to a situation in which there is a correlation or relationship between an explanatory variable and the error term in a statistical model. This correlation can arise when the explanatory variable is influenced by factors that are not accounted for in the model, leading to biased and inconsistent estimates of the model parameters. (2) Why Does Endogeneity Occur ? In the context of regression analysis, endogeneity can occur when one or more of the following conditions are
-
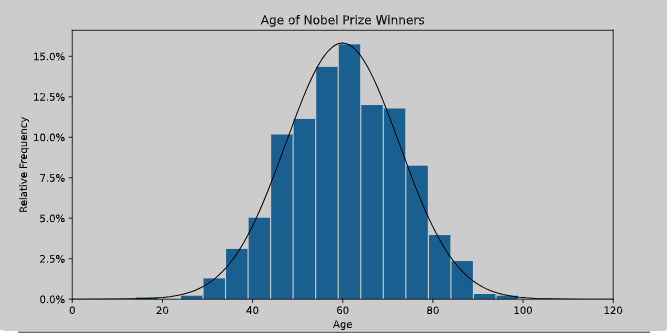
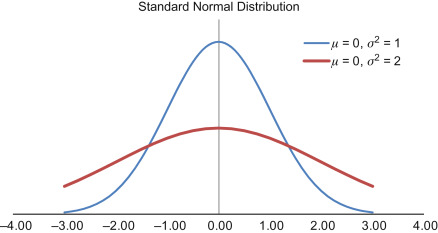
Linear Regression – Assumption – 3(Normal Distribution Of Error Term)
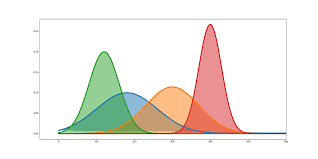
Normal Distribution Of Error Term Table Of Contents: What Is A Normal Distribution? Why Normal Distribution Is Matter? Why Is Error Term Should Be Normally Distributed? Remedies For Non-Normal Error Distribution. (1) What Is A Normal Distribution? In a normal distribution, data is symmetrically distributed with no skew. When plotted on a graph, the data follows a bell shape, with most values clustering around a central region and tapering off as they go further away from the center. Normal distributions are also called Gaussian distributions or bell curves because of their shape. (2) Why Normal Distribution Is Important? All kinds of variables in
-
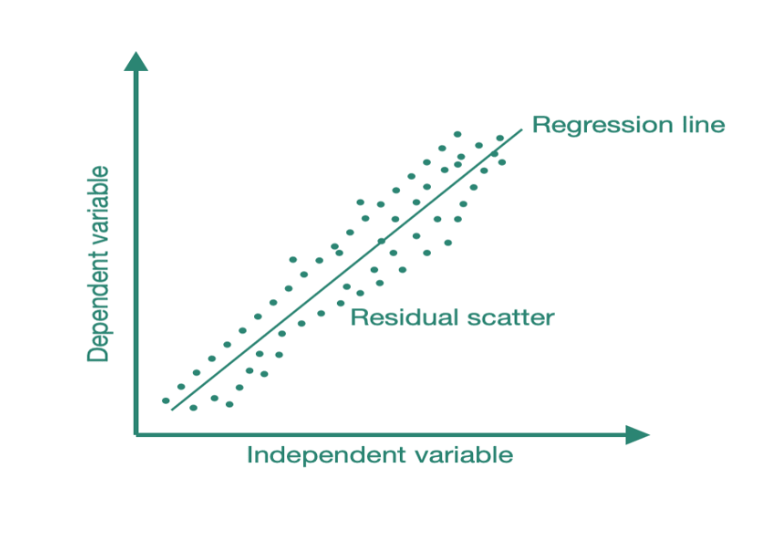
Mean Of Error Term Should Be Zero.
Mean Of Error Term Should Be Zero Table Of Contents: What Is Error Term In the Regression Model? Error Term Use In Formula. The Difference Between Error Terms and Residuals. Mean Of Error Term Should Be Zero. (1) What Is Error Term In Regression Model? An error term is a residual variable produced by a statistical or mathematical model, which is created when the model does not fully represent the actual relationship between the independent variables and the dependent variables. As a result of this incomplete relationship, the error term is the amount at which the equation may differ during
-
Linear Regression – Assumption – 4 (What Is Homoscedasticity ?)
What Is Homoscedasticity? Table Of Contents: What Is Homoscedasticity? What Is Heteroscedasticity? Example Of Home & Heteroscedasticity. Problem With Heteroscedasticity. Test For Heteroscedasticity. The Importance Of Homoscedasticity. Why Does Heteroscedasticity Occur? How To Remove Heteroscedasticity? (1) What Is Homoscedasticity? Homoscedasticity, or homogeneity of variances, is an assumption of equal or similar variances in different groups being compared. This is an important assumption of parametric statistical tests because they are sensitive to any dissimilarities. Uneven variances in samples result in biased and skewed test results. Homoscedasticity describes a situation in which the error term (that is, the “noise” or random disturbance in the relationship between
-
Auto Feature Engineering
{ "cells": [ { "cell_type": "markdown", "id": "7d018438", "metadata": {}, "source": [ "## Auto Feature Engineering Sample Code" ] }, { "cell_type": "code", "execution_count": 149, "id": "8d9d4ab7", "metadata": {}, "outputs": [], "source": [ "import pandas as pdn", "import featuretools as ft" ] }, { "cell_type": "code", "execution_count": 150, "id": "228497a3", "metadata": {}, "outputs": [ { "data": { "text/html": [ "<div>n", "<style scoped>n", " .dataframe tbody tr th:only-of-type {n", " vertical-align: middle;n", " }n", "n", " .dataframe tbody tr th {n", " vertical-align: top;n", " }n", "n", " .dataframe thead th {n", " text-align: right;n", " }n", "</style>n", "<table border="1" class="dataframe">n",
