-
Linear Regression – What Is a Biased Estimator In Linear Regression?
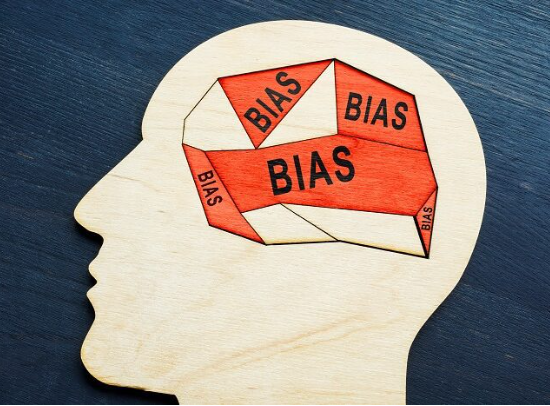
What Is a Biased Estimator In Linear Regression? In linear regression, estimator biasness refers to the systematic deviation of the estimated coefficients from their true population values. A biased estimator consistently produces estimates that, on average, differ from the true values in a predictable manner. In the context of linear regression, the biases of an estimator can occur for different reasons: Omitted Variable Bias: If relevant variables are excluded from the regression model, the estimated coefficients may be biased. Omitted variable bias arises when the omitted variables are correlated with both the independent variables included in the model and the
-
Linear Regression – Assumption – 6 (What Is Endogeneity?)
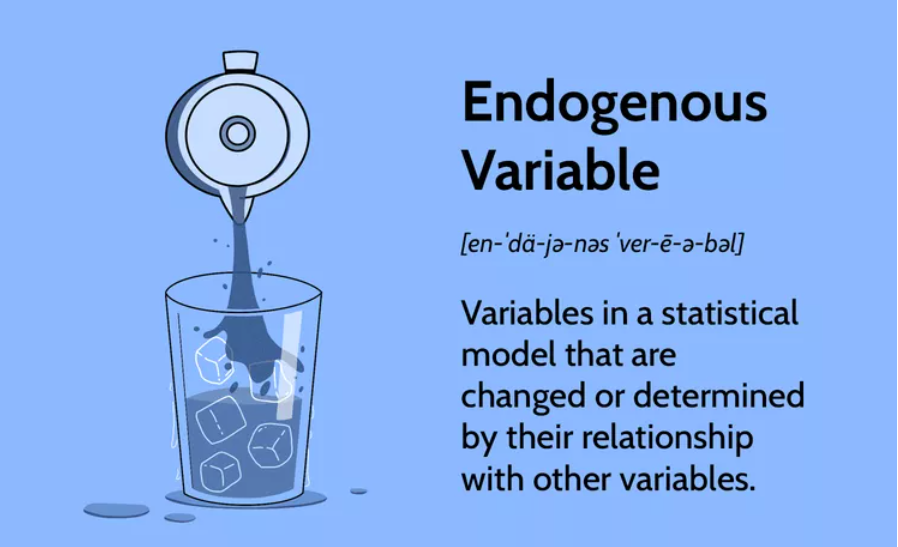
What Is Endogeneity Table Of Contents: What Is Endogeneity? Why Does Endogeneity occur? How To Avoid Endogeneity? (1) What Is Endogeneity? Endogeneity refers to a situation in which there is a correlation or relationship between an explanatory variable and the error term in a statistical model. This correlation can arise when the explanatory variable is influenced by factors that are not accounted for in the model, leading to biased and inconsistent estimates of the model parameters. (2) Why Does Endogeneity Occur ? In the context of regression analysis, endogeneity can occur when one or more of the following conditions are
-
Linear Regression – Assumption – 3(Normal Distribution Of Error Term)
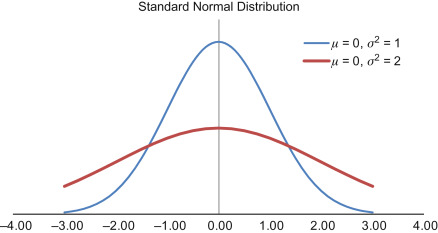
Normal Distribution Of Error Term Table Of Contents: What Is A Normal Distribution? Why Normal Distribution Is Matter? Why Is Error Term Should Be Normally Distributed? Remedies For Non-Normal Error Distribution. (1) What Is A Normal Distribution? In a normal distribution, data is symmetrically distributed with no skew. When plotted on a graph, the data follows a bell shape, with most values clustering around a central region and tapering off as they go further away from the center. Normal distributions are also called Gaussian distributions or bell curves because of their shape. (2) Why Normal Distribution Is Important? All kinds of variables in
-
Mean Of Error Term Should Be Zero.
Mean Of Error Term Should Be Zero Table Of Contents: What Is Error Term In the Regression Model? Error Term Use In Formula. The Difference Between Error Terms and Residuals. Mean Of Error Term Should Be Zero. (1) What Is Error Term In Regression Model? An error term is a residual variable produced by a statistical or mathematical model, which is created when the model does not fully represent the actual relationship between the independent variables and the dependent variables. As a result of this incomplete relationship, the error term is the amount at which the equation may differ during
-
Linear Regression – Assumption – 4 (What Is Homoscedasticity ?)
What Is Homoscedasticity? Table Of Contents: What Is Homoscedasticity? What Is Heteroscedasticity? Example Of Home & Heteroscedasticity. Problem With Heteroscedasticity. Test For Heteroscedasticity. The Importance Of Homoscedasticity. Why Does Heteroscedasticity Occur? How To Remove Heteroscedasticity? (1) What Is Homoscedasticity? Homoscedasticity, or homogeneity of variances, is an assumption of equal or similar variances in different groups being compared. This is an important assumption of parametric statistical tests because they are sensitive to any dissimilarities. Uneven variances in samples result in biased and skewed test results. Homoscedasticity describes a situation in which the error term (that is, the “noise” or random disturbance in the relationship between
-
Auto Feature Engineering
{ "cells": [ { "cell_type": "markdown", "id": "7d018438", "metadata": {}, "source": [ "## Auto Feature Engineering Sample Code" ] }, { "cell_type": "code", "execution_count": 149, "id": "8d9d4ab7", "metadata": {}, "outputs": [], "source": [ "import pandas as pdn", "import featuretools as ft" ] }, { "cell_type": "code", "execution_count": 150, "id": "228497a3", "metadata": {}, "outputs": [ { "data": { "text/html": [ "<div>n", "<style scoped>n", " .dataframe tbody tr th:only-of-type {n", " vertical-align: middle;n", " }n", "n", " .dataframe tbody tr th {n", " vertical-align: top;n", " }n", "n", " .dataframe thead th {n", " text-align: right;n", " }n", "</style>n", "<table border="1" class="dataframe">n",
-
Linear Regression Pipeline
{ "cells": [ { "cell_type": "markdown", "id": "f70cba96", "metadata": {}, "source": [ "### Configuration Variables." ] }, { "cell_type": "code", "execution_count": 1, "id": "84c02166", "metadata": {}, "outputs": [], "source": [ "# We Need To Provide All These Variables Before Proceding.n", "# All Column Names Of Your DataSet.n", "all_columns = ["Meter","dt","Global_reactive_power","Voltage","Global_intensity","Sub_metering_1","Sub_metering_2","Sub_metering_3","Power_Consumption"] n", "# Columns You Want To Drop From Your DataSet.n", "dropped_columns = ["dt"]n", "# Columns You Want To Train Your Model.n", "training_columns = ["Global_reactive_power","Voltage","Sub_metering_1","Sub_metering_2","Sub_metering_3"]n", "# Target Column You Are Predicting.n", "target_column = "Power_Consumption"n", "# Name Of The Column You Want To Do Iteration.n", "iter_column = ‘Meter’n", "# Input File Locationn",
-
Sales Forecasting
-
Linear Regression Model.
{ "cells": [ { "cell_type": "code", "execution_count": 33, "id": "ae07aeb9", "metadata": {}, "outputs": [ { "name": "stdout", "output_type": "stream", "text": [ "best params:- {‘lasso__alpha’: 0.1}n", "R2 Score: 45%n", "best params:- {‘xgbregressor__learning_rate’: 0.1}n", "R2 Score: 56%n", "best params:- {‘ridge__alpha’: 10.0}n", "R2 Score: 56%n", "best params:- {‘elasticnet__alpha’: 0.021544346900318832}n", "R2 Score: 55%n", "best params:- {‘lasso__alpha’: 0.1}n", "R2 Score: 45%n", "best params:- {‘xgbregressor__learning_rate’: 0.1}n", "R2 Score: 56%n", "best params:- {‘ridge__alpha’: 10.0}n", "R2 Score: 56%n", "best params:- {‘elasticnet__alpha’: 0.021544346900318832}n", "R2 Score: 55%n", "best params:- {‘lasso__alpha’: 0.1}n", "R2 Score: 47%n", "best params:- {‘xgbregressor__learning_rate’: 0.9}n", "R2 Score: 57%n", "best params:- {‘ridge__alpha’: 10.0}n", "R2 Score: 57%n", "best params:-
-
Color Code.
Color Code Heading: #06FFE8Example Heading: #00FFC0SubHeading: #B2FF03SubHeading:#F1FF00SubHeading: #00FFC0 SubSubHeading: #FFBE02Sub: #6ec1e4Colour: #88FF75 #5DFF00 Image Size: 640 * 426
