-
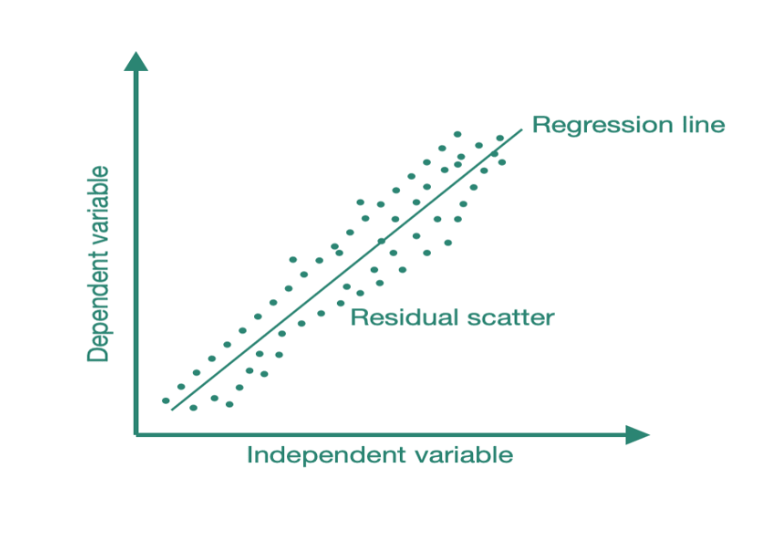
Mean Of Error Term Should Be Zero.
Mean Of Error Term Should Be Zero Table Of Contents: What Is Error Term In the Regression Model? Error Term Use In Formula. The Difference Between Error Terms and Residuals. Mean Of Error Term Should Be Zero. (1) What Is Error Term In Regression Model? An error term is a residual variable produced by a statistical or mathematical model, which is created when the model does not fully represent the actual relationship between the independent variables and the dependent variables. As a result of this incomplete relationship, the error term is the amount at which the equation may differ during
-
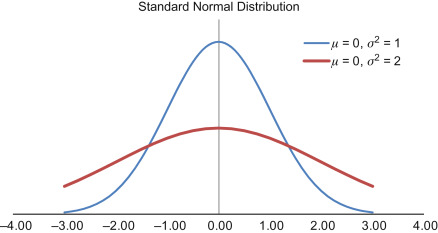
Linear Regression – Assumption – 4 (What Is Homoscedasticity ?)
What Is Homoscedasticity? Table Of Contents: What Is Homoscedasticity? What Is Heteroscedasticity? Example Of Home & Heteroscedasticity. Problem With Heteroscedasticity. Test For Heteroscedasticity. The Importance Of Homoscedasticity. Why Does Heteroscedasticity Occur? How To Remove Heteroscedasticity? (1) What Is Homoscedasticity? Homoscedasticity, or homogeneity of variances, is an assumption of equal or similar variances in different groups being compared. This is an important assumption of parametric statistical tests because they are sensitive to any dissimilarities. Uneven variances in samples result in biased and skewed test results. Homoscedasticity describes a situation in which the error term (that is, the “noise” or random disturbance in the relationship between
-
Auto Feature Engineering
{ "cells": [ { "cell_type": "markdown", "id": "7d018438", "metadata": {}, "source": [ "## Auto Feature Engineering Sample Code" ] }, { "cell_type": "code", "execution_count": 149, "id": "8d9d4ab7", "metadata": {}, "outputs": [], "source": [ "import pandas as pdn", "import featuretools as ft" ] }, { "cell_type": "code", "execution_count": 150, "id": "228497a3", "metadata": {}, "outputs": [ { "data": { "text/html": [ "<div>n", "<style scoped>n", " .dataframe tbody tr th:only-of-type {n", " vertical-align: middle;n", " }n", "n", " .dataframe tbody tr th {n", " vertical-align: top;n", " }n", "n", " .dataframe thead th {n", " text-align: right;n", " }n", "</style>n", "<table border="1" class="dataframe">n",
-
Linear Regression Pipeline
{ "cells": [ { "cell_type": "markdown", "id": "f70cba96", "metadata": {}, "source": [ "### Configuration Variables." ] }, { "cell_type": "code", "execution_count": 1, "id": "84c02166", "metadata": {}, "outputs": [], "source": [ "# We Need To Provide All These Variables Before Proceding.n", "# All Column Names Of Your DataSet.n", "all_columns = ["Meter","dt","Global_reactive_power","Voltage","Global_intensity","Sub_metering_1","Sub_metering_2","Sub_metering_3","Power_Consumption"] n", "# Columns You Want To Drop From Your DataSet.n", "dropped_columns = ["dt"]n", "# Columns You Want To Train Your Model.n", "training_columns = ["Global_reactive_power","Voltage","Sub_metering_1","Sub_metering_2","Sub_metering_3"]n", "# Target Column You Are Predicting.n", "target_column = "Power_Consumption"n", "# Name Of The Column You Want To Do Iteration.n", "iter_column = ‘Meter’n", "# Input File Locationn",
-
Sales Forecasting
-
Linear Regression Model.
{ "cells": [ { "cell_type": "code", "execution_count": 33, "id": "ae07aeb9", "metadata": {}, "outputs": [ { "name": "stdout", "output_type": "stream", "text": [ "best params:- {‘lasso__alpha’: 0.1}n", "R2 Score: 45%n", "best params:- {‘xgbregressor__learning_rate’: 0.1}n", "R2 Score: 56%n", "best params:- {‘ridge__alpha’: 10.0}n", "R2 Score: 56%n", "best params:- {‘elasticnet__alpha’: 0.021544346900318832}n", "R2 Score: 55%n", "best params:- {‘lasso__alpha’: 0.1}n", "R2 Score: 45%n", "best params:- {‘xgbregressor__learning_rate’: 0.1}n", "R2 Score: 56%n", "best params:- {‘ridge__alpha’: 10.0}n", "R2 Score: 56%n", "best params:- {‘elasticnet__alpha’: 0.021544346900318832}n", "R2 Score: 55%n", "best params:- {‘lasso__alpha’: 0.1}n", "R2 Score: 47%n", "best params:- {‘xgbregressor__learning_rate’: 0.9}n", "R2 Score: 57%n", "best params:- {‘ridge__alpha’: 10.0}n", "R2 Score: 57%n", "best params:-
-
Color Code.
Color Code Heading: #06FFE8Example Heading: #00FFC0SubHeading: #B2FF03SubHeading:#F1FF00SubHeading: #00FFC0 SubSubHeading: #FFBE02Sub: #6ec1e4Colour: #88FF75 #5DFF00 Image Size: 640 * 426
-
GIT Commands
GIT Commands (1) How To Pull Code From A Remote Branch To Local?======================================================Step-1: git checkout -b hotfix/R110.1_Update1 Step-2: git pull origin hotfix/R110.1_Update1 Step-3: Go To Your Pycham And Files And Reload From Disk (2) How To Cloan A GIT Branch ?====================================git clone – single-branch – branch release/R121.1 https://[email protected]/scm/oa/operationsadvisor.git git clone – single-branch – branch Insight_Service/Intermediate_R121.1 https://[email protected]/scm/oa/operationsadvisor.git git clone – single-branch – branch Insight_Service/R120.1 https://[email protected]/scm/oa/operationsadvisor.git git clone – single-branch – branch release/R120.1 https://[email protected]/scm/oa/operationsadvisor.git git clone – single-branch – branch Insight_Service/Merge_branch_R121.1 https://[email protected]/scm/oa/operationsadvisor.git git clone – single-branch – branch vishnu/Intermediate_R121.1 https://[email protected]/scm/oa/operationsadvisor.git (3) How To Create A New Branch ?========================================Step-1: Go To Bit Bucket
-
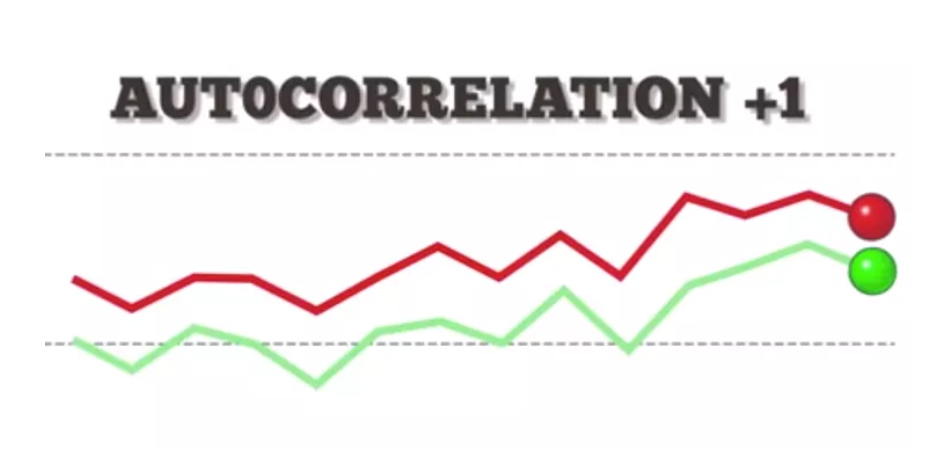
Linear Regression – Assumption – 5 (What Is Auto Correlation ?)
What Is Auto Correlation Table Of Contents: What Is Autocorrelation? Types Of Autocorrelation. How To Test For Autocorrelation? Example Of Autocorrelation. The implications of autocorrelation. Durbin-Watson Test In Python. How To Remove Autocorrelation In Model? (1) What Is Autocorrelation? Autocorrelation refers to the degree of correlation of the same variables between two successive time intervals. It measures how the lagged version of the value of a variable is related to the original version of it in a time series. Autocorrelation, as a statistical concept, is also known as serial correlation. The analysis of autocorrelation helps to find repeating periodic patterns,
-
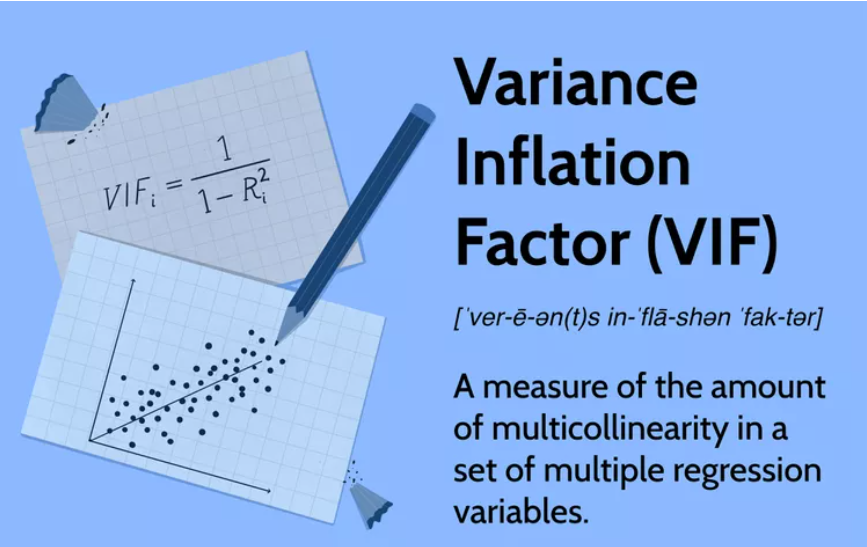
Linear Regression – Assumption – 2 (What Is Variance Inflection Factor?)
What Is Variance Inflection Factor? Table Of Contents: What Is the Variance Inflection Factor? The Problem Of Multicollinearity? Testing For Multicollinearity? Formula For VIF. Interpretation Of VIF. Why Use VIFs Rather Than Pairwise Correlations? Example Of Calculating VIF. (1) What Is Variance Inflection Factor? Variance Inflection Factor is used to measure, how much the variance of the beta estimates has inflected due to multicollinearity issue. A variance inflation factor (VIF) provides a measure of multicollinearity among the independent variables in a multiple regression model. Detecting multicollinearity is important because while multicollinearity does not reduce the explanatory power of the model,
