-

Linear Regression Algorithm
Linear Regression Algorithm Table Of Contents: What Is Linear Regression? Equation For Linear Regression. Types Of Linear Regression. Linear Regression Line. How To Find The Best Fit Line? Cost Function For Linear Regression. Assumptions In Linear Regression. (1) What Is Linear Regression Model? It’s a Supervised Learning algorithm which goal is to predict continuous, numerical values based on given data input. If you want to mathematically model the behavior of a continuous variable you can use Linear Regression model. First as a Data Scientist you need to find out, what are the factors affecting the continuous variable. Then you can use
-

Reinforcement Machine Learning Algorithms.
-

Semisupervised Machine Learning Algorithms.
-

Unsupervised Machine Learning Algorithms.
Unsupervised Machine Learning Algorithms. Table Of Contents: What Is Unsupervised Machine Learning? Examples Of Unsupervised Machine Learning. Types Of Unsupervised Learning Algorithms. Unsupervised Machine Learning Algorithms. (1) What Is Unsupervised Machine Learning? Unsupervised learning is a method in which a machine learns without supervision. The machine learns by itself in an Unsupervised Learning style. The training is provided to the machine with the data set that has not been labeled, classified, or categorized, and the algorithm needs to act on that data without supervision. Unsupervised learning aims to restructure the input data into new features or a group of objects
-

Supervised Machine Learning Algorithms.
Supervised Learning Algorithms Table Of Contents: What Is Supervised Machine Learning. Examples Of Supervised Machine Learning. Types Of Supervised Learning Algorithms. Supervised Learning Algorithms. (1) What Is Supervised Machine Learning? Supervised Machine learning, is defined by its use of labeled datasets to train algorithms to classify data or predict outcomes accurately. As input data is fed into the model, the model adjusts its weights until it has been fitted appropriately. In supervised learning, the training data provided to the machines work as the supervisor that teaches the machines to predict the output correctly. (2) Examples Of Supervised Machine Learning. Example-1:
-

Data Science Algorithms.
Data Science Algorithms Table Of Contents: Types Of Machine Learning. Supervised Learning. Unsupervised Learning. Semi-Supervised Learning. Reinforcement Learning. (1)Types Of Machine Learning. Based on the way and style of machine learning from the data, Machine Learning is divided into 4 types. Supervised Machine Learning. Unsupervised Machine Learning. Semi-Supervised Machine Learning. Reinforcement Machine Learning. (2) Supervised Machine Learning. Supervised Machine learning, is defined by its use of labeled datasets to train algorithms to classify data or predict outcomes accurately. As input data is fed into the model, the model adjusts its weights until it has been fitted appropriately. In supervised learning,
-

What Is Data Science ?
What Is Data Science ? Table Of Contents: What Is Data Science? Why We Need Data Science? Data Science Prerequisites. What Is Data Science Used For Applications Of Data Science. Algorithms In Data Science. (1) What Is Data Science? Data Science is the study of data to extract meaningful insights for business. It is a multidisciplinary approach that combines principles and practices from the fields of mathematics, statistics, artificial intelligence, and computer engineering to analyze large amounts of data. This analysis helps Data Scientists to ask and answer questions like what happened, why it happened, what will happen, and what
-
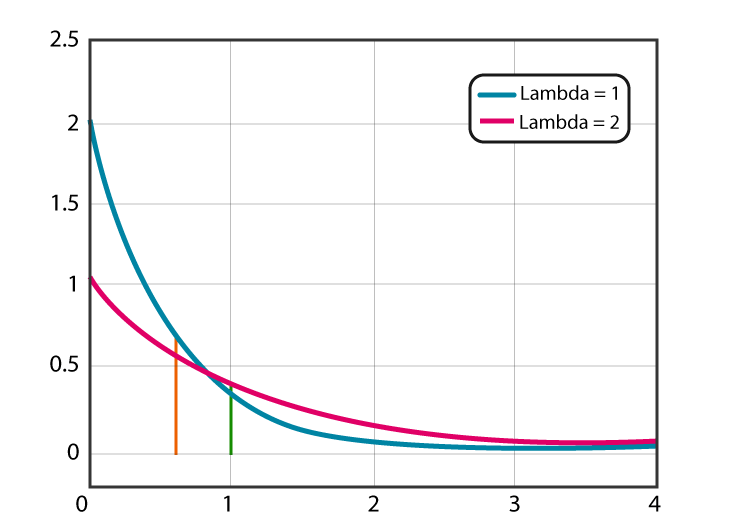
What Is Exponential Distribution?
What Is Exponential Distribution? Table Of Contents: What Is Exponential Distribution? Formula For Exponential Distribution. Diagram For Exponential Distribution. Examples Of Exponential Distribution. (1) What Is Exponential Distribution? The Exponential Distribution is a continuous distribution that is commonly used to measure the expected time for an event to occur. For example, in physics, it is often used to measure radioactive decay. In engineering, it is used to measure the time associated with receiving a defective part on an assembly line. In finance, it is often used to measure the likelihood of the next default for a portfolio of financial assets. For
-
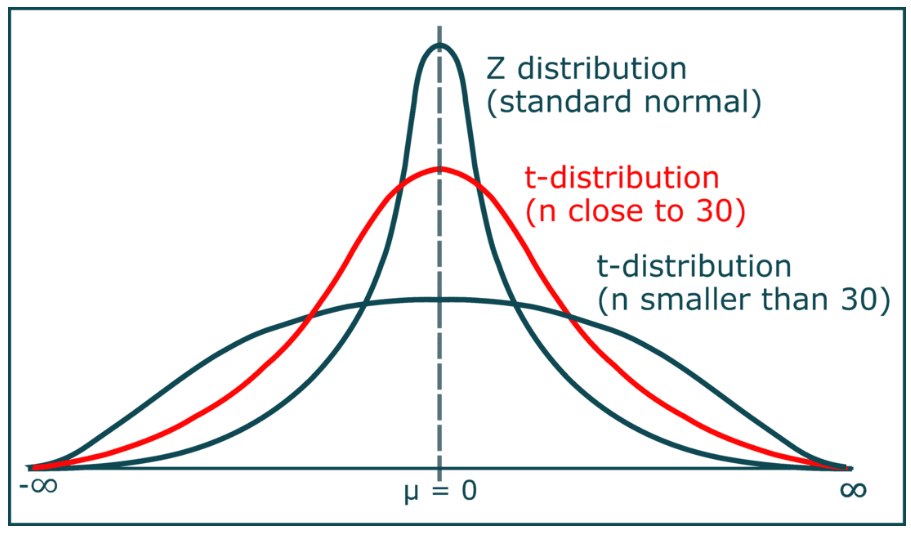
What Is Student T Distribution ?
What Is Student’s T – Distribution? Table Of Contents: What is Student’s T – Distribution? Formula For Student’s T – Distribution. Diagram For Student’s T – Distribution. Examples Of Student’s T – Distribution. (1) What Is Student’s T – Distribution? Student’s t-distribution, also known as the t-distribution, is a continuous probability distribution that is used in statistics for making inferences about the population mean when the sample size is small or when the population standard deviation is unknown. It is similar to the standard normal distribution (Z-distribution), but it has heavier tails. The t-distribution is used instead of the normal
-
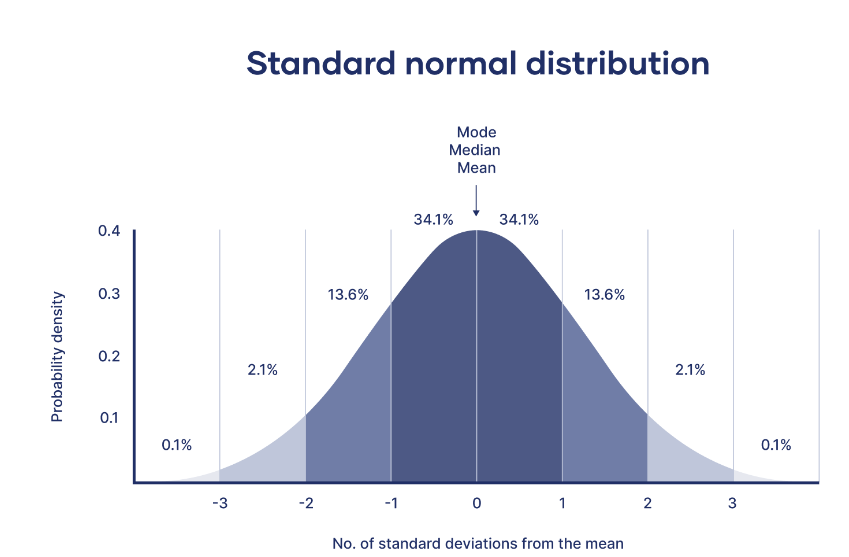
What Is Standard Normal Distribution?
What Is Standard Normal Distribution? Table Of Contents: What Is Standard Normal Distribution? Formula For Standard Normal Distribution. Diagram For Standard Normal Distribution. Examples Of Standard Normal Distribution. (1) What Is Standard Normal Distribution? The standard normal distribution, also called the z-distribution, is a special normal distribution where the mean is 0 and the standard deviation is 1. Every normal distribution is a version of the standard normal distribution that’s been stretched or squeezed and moved horizontally right or left. While individual observations from normal distributions are referred to as x, they are referred to as z in the z-distribution. Every normal distribution can be converted
