-
How To Select Root Node For The Decision Tree?
How To Choose Root Node For Decision Tree? Table Of Contents: How To Choose Root Node For Decision Tree? How To Choose Root Node For Decision Tree? Let’s build a decision tree for a dataset to decide whether to Play Tennis based on conditions like weather, temperature, humidity, and wind. Step-1: Calculate The Overall Entropy Overall entropy tells us how much dataset is disordered initially. Step-2: Calculate Information Gain For Each Attribute. We now calculate the Information Gain for each attribute by splitting the dataset based on its values. Step-3: Choose the Attribute With The Highest Information Gain The attribute
-

Topics To Learn In Decision Tree.
Topics To Learn In Decision Tree. Table Of Contents: Basic Understanding of Decision Trees. Splitting Criteria. Building a Decision Tree. Overfitting and Underfitting. Hyperparameters of Decision Trees. Handling Categorical Data. Evaluation Metrics for Decision Trees. Practical Implementation. Real-world Use Cases. Advancement In Decision Tree. (1) Basic Understanding of Decision Trees. (2) Splitting Criteria (3) Building a Decision Tree (4) Overfitting and Underfitting (5) Hyperparameters of Decision Trees. (6) Handling Categorical Data. (7) Evaluation Metrics for Decision Trees (8) Practical Implementation (9) Real-world Use Cases (10) Advanced Topics
-

Interview Questions On Linear Regression.
Interview Questions On Linear Regression. Table Of Contents: What is linear regression? Explain the assumptions of a linear regression model. What is the difference between simple and multiple linear regression? What is multicollinearity, and how do you detect it? What are residuals in linear regression? What is the cost function used in linear regression? How do you find the optimal parameters in linear regression? Explain the formula for the regression line. What is R-squared? What is the adjusted R-squared, and why is it important? How do you handle categorical variables in linear regression? What would you do if your model
-
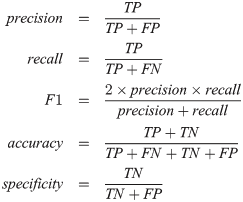
Accuracy, Precision, Recall, F1-Score
Confusion Metrics, Accuracy, Precision, Recall, F1-Score Table Of Contents: Confusion Metrics Accuracy Precision Recall F1-Score Specificity (True Negative Rate) Fall-Out : False Positive Rate (FPR) Miss Rate: False Negative Rate (FNR) Balanced Accuracy Example Of Confusion Metrics Confusion Metrics For Multiple Class (1) Confusion Metrics A confusion matrix is a tabular representation of the performance of a classification model. It helps visualize and understand how well a model’s predictions align with the actual outcomes, especially in binary and multi-class classification. (2) Structure Of Confusion Metrics Definition: (3) Accuracy For imbalanced dataset Accuracy will give the wrong impression about the model
-
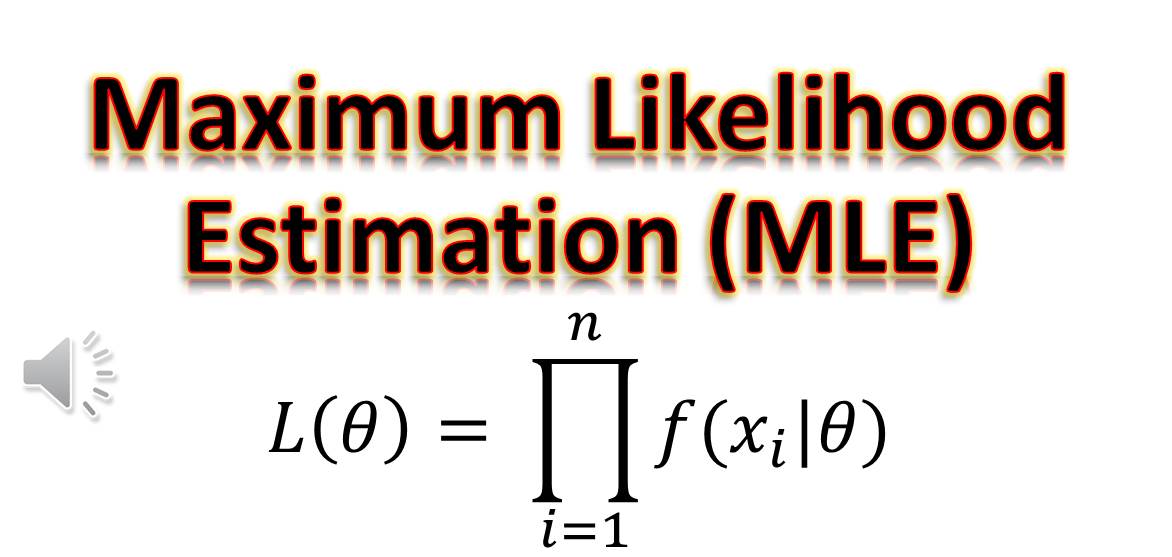
Why We Use Maximum Likelihood Estimation In Logistic Regression?
Why We Use Maximum Likelihood Estimation In Logistic Regression? Maximum Likelihood find out where the Probability is maximum. Minimizing the Loss identifies where the loss is minimum. Table Of Contents: Difference In Maximizing Likelihood and Minimum Loss. (1) How To Find Maximum Likelihood? (2) Maximum Likelihood For Logistic Regression (3) Difference In Maximizing Likelihood and Minimum Loss. (2) Why Differentiating To Zero Gives Us Maximize Log-Likelihood: Differentiating a function and setting it equal to zero helps us find the critical points, which could be maxima, minima, or saddle points. In the context of Maximum Likelihood Estimation (MLE), this principle is
-
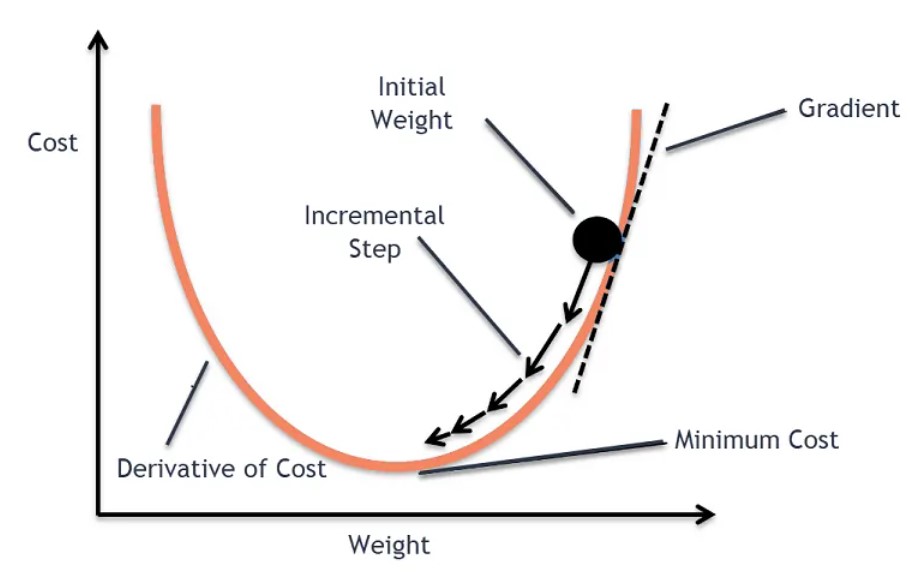
Why We Don’t Use Gradient Descent Algorithm In Linear Regression?
Why We Don’t Use Gradient Descent Algorithm In Linear Regression? Table Of Contents: hI (1) Reason We do apply gradient descent to linear regression, but often it’s not necessary because linear regression has a closed-form solution that is computationally efficient for small to medium-sized datasets. Let me explain: Closed-Form Solution for Linear Regression Here we can directly take the derivative of the Loss function and equate it to zero. Then we can solve the equation to get the optimal value of the beta. How Can We Directly Equate A Single Derivative To Zero To Get The Beta Value. We can
-

Logistic Regression Topics.
Logistic Regression Topics Table Of Contents: Introduction to Logistic Regression Mathematical Foundation Model Fitting Assumptions of Logistic Regression Feature Engineering for Logistic Regression Evaluation Metrics for Logistic Regression Regularization in Logistic Regression Advanced Topics Model Interpretation Practical Considerations Common Problems in Logistic Regression Implementation in Programming Applications of Logistic Regression (1) Introduction to Logistic Regression (2) Assumptions of Logistic Regression (3) Mathematical Foundation (4) Model Fitting (5) Feature Engineering for Logistic Regression (6) Evaluation Metrics for Logistic Regression (7) Regularization in Logistic Regression (8) Extensions of Logistic Regression (9) Challenges and Solutions (10) Advanced Topics (11) Model Interpretation (12) Practical
-
Linear Regression – (R – Squared and Adjusted R – Squared)
R- Squared and Adjusted R-Squared Table Of Contents: What Is R-Squared Value? Formula For R-Squared Value. Interpretation Of R-Squared Value. Example Of R-Squared. Key Points To Note. Conclusion. (1) What Is R-Squared Value? R-squared, also known as the coefficient of determination, is a statistical measure that shows how well the independent variable(s) in a regression model explain the variability of the dependent variable. It provides an indication of the model’s goodness of fit. (2) Formula For R Squared Value (3) Interpretation Of R-Squared (4) Example Of R-Squared (5) Key Points To Note (6) Conclusion (7) Adjusted R-Squared Adjusted R-squared is
-

Linear Regression Topics
Linear Regression Topics Table Of Contents: Basics of Linear Regression Model Components Assumptions of Linear Regression Diagnostics Violations of Assumptions Statistical Concepts Model Evaluation Extensions and Variants Feature Engineering for Linear Regression Advanced Topics (1) Basics Of Linear Regression (2) Assumptions of Linear Regression (3) Model Components (4) Statistical Concepts (5) Diagnostics (6) Extensions and Variants (7) Model Evaluation (8) Violations of Assumptions (9) Feature Engineering for Linear Regression (10) Advanced Topics
-

Linear Regression – Assumption – 5 (Autocorrelation In Regression)
Autocorrelation Table Of Contents: What Is Autocorrelation? Assumption Of No Autocorrelation. Why No Autocorrelation Is Important? Common Causes Of Autocorrelation. Detecting Autocorrelation. Addressing Autocorrelation. Examples Of Autocorrelation In Residuals. (1) What Is Autocorrelation? In linear regression, autocorrelation refers to the correlation of the residuals (errors) of the model with themselves, particularly in time-series data or data with a sequential nature. The assumption of no autocorrelation is one of the key assumptions for the validity of a linear regression model. (2) Assumption Of No Autocorrelation. (3) Why No Autocorrelation Is Important? (4) Common Causes Of Autocorrelation. Omitted Variables: Missing important predictors
