-

AR – Model Python Example
AR – Model Python Example Table Of Contents: Steps Involved In Time Series Forecasting. Python Example For Electricity Consumption Prediction. (1) Steps Involved In Time Series Forecasting. The following are some of the key steps which need to be done for training the AR model: Plot The Time-Series Check The Stationarity Determine The Parameter ‘p’ or Order Of The AR Model Train The Model Predict From The Model (2) Electricity Forecasting. Importing Required Libraries: import pandas as pd import numpy as np import matplotlib.pyplot as plt from statsmodels.tsa.ar_model import AutoReg Reading Input Data: df = pd.read_csv(‘Electric_Consumption.csv’) Plotting Consumption Details: df[‘Consumption’].plot(figsize=(20,
-

Auto Regressive Time Series Model.
Auto Regressive Time Series Model. Table Of Contents: Auto Regression Model. Assumptions Of Auto Regression Model. AR(P) Model. AR(P) Model Examples. Examples Of AR Model. How Auto-Regressive Model Works? Auto Correlation Function (ACF). Interpreting ACF Plot. Partial AutoCorrelation Function(PACF). Interpreting PACF Plot. (1) Auto Regressive Model An autoregressive (AR) model is a type of time series model that predicts the future values of a variable based on its past values. It assumes that the current value of the variable depends linearly on its previous values and a stochastic (random) term. The term “autoregressive” refers to the fact that the model
-

Time Series Decomposition.
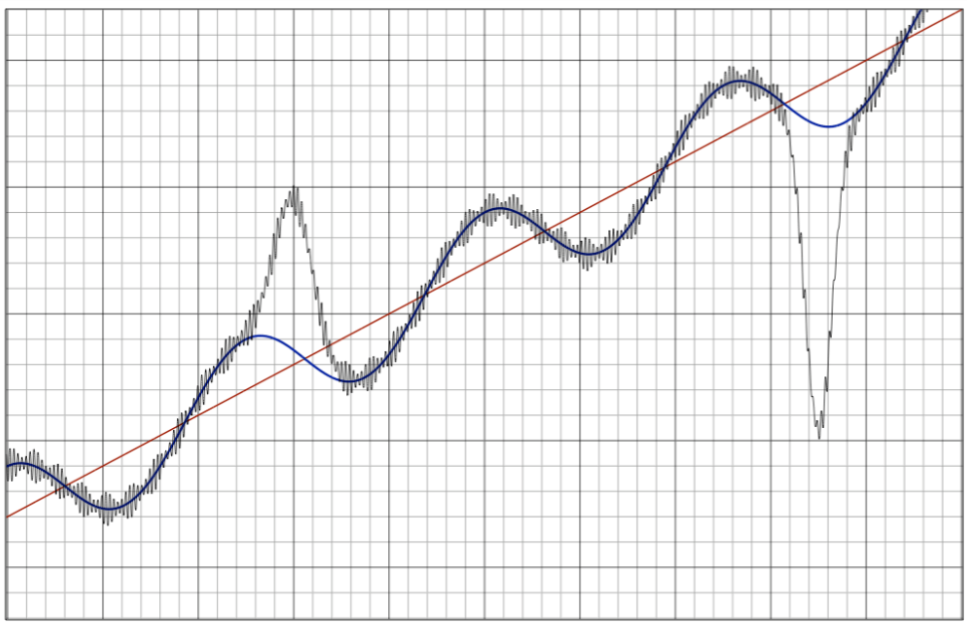
Time Series Decomposition Technique. Table Of Contents: Introduction. Decomposition (1) Decomposition Decomposition in time series analysis refers to the process of breaking down a time series into its individual components, typically trend, seasonality, and remainder (or residual) components. The decomposition allows us to better understand the underlying patterns and variations present in the time series data. (2) Components Of Time Series Trend: The trend component represents the long-term direction or movement of the time series. It captures the overall systematic increase or decrease in the series over time. The trend can be linear, polynomial, exponential, or other functional forms depending
-

Time Series Algorithms.
Time Series Algorithms Table Of Contents: Introduction. Decomposition AR MA ARIMA Seasonal ARIMA (SARIMA) Exponential Smoothing (ES) Vector Autoregression (VAR) Seasonal Decomposition of Time Series (STL) Gaussian Processes (GP) Long Short-Term Memory (LSTM) Networks Prophet Framework State-Space Models Bayesian Structural Time Series (BSTS) Holt-Winters Exponential Smoothing Box-Jenkins Multivariate Models Box-Jenkins ARIMA Models Intervention Analysis Wavelet Analysis Time Series Clustering (1) Introduction Time series analysis can offer valuable insights into stock prices, sales figures, customer behaviour, and other time-dependent variables. By leveraging these techniques, businesses can make informed decisions, optimize operations, and enhance long-term strategies. Time series analysis offers a multitude
-

How To Convert Non-Stationary To Stationary Time Series Data.?
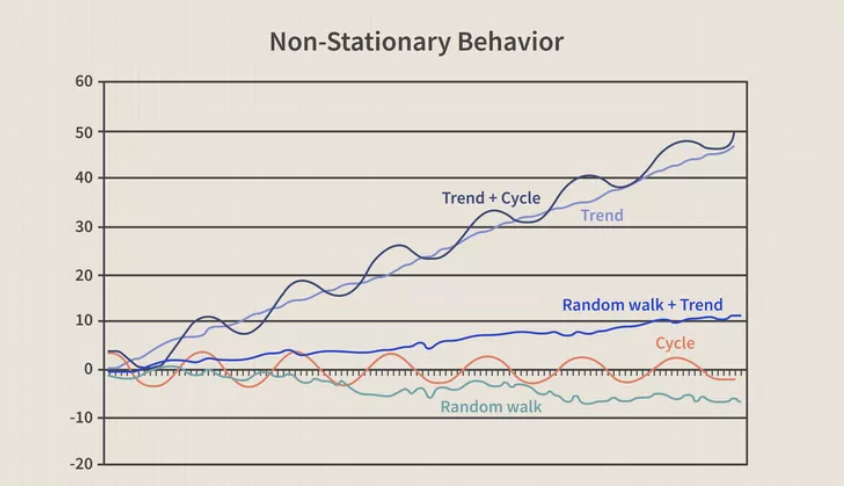
How To Convert Non-Stationary To Stationary Time Series Data? Table Of Contents: Introduction. Detrending. Differencing. Transformation. (1) Introduction ‘Stationarity’ is one of the most important concepts you will come across when working with time series data. A stationary series is one in which the properties – mean, variance and covariance, do not vary with time. Let us understand this using an intuitive example. Consider the three plots shown below: In the first plot, we can see that the mean varies (increases) with time which results in an upward trend. Thus, this is a non-stationary series. For a series to be
-
Why Time Series Data Need To Be Stationary?
Why Time Series Data Needs To Be Stationary ? (1) Reason-1 In Time Series data we know that the current data value is dependent on the previous data values. Which means there is a relationship between previous values and current values. If the data set is non-stationary the mean and variance of the data will change over time. As time series uses only one variable for prediction, with changing mean and variance it will be difficult to calculate the relationship between past values. Hence Time Series demands the Stationarity of data. (2) Reason-2 What quantities are we typically interested in
-
Time Series Analysis
Time Series Analysis Table Of Contents: What Is Time Series Analysis? How to Analyze Time Series? Significance of Time Series Components of Time Series Analysis What Are the Limitations of Time Series Analysis? Data Types of Time Series Methods to Check Stationarity Converting Non-Stationary Into Stationary Moving Average Methodology Time Series Analysis in Data Science and Machine Learning What Is an Auto-Regressive Model? Implementation of Auto-Regressive Model Implementation of Moving Average (Weights – Simple Moving Average) Understanding ARMA and ARIMA Understand the signature of ARIMA Process Flow (Re-Gap) Conclusion Frequently Asked Questions (1) What Is Time Series Analysis Time series
-

Linear Regression – Evaluation Matrices
Linear Regression – Evaluation Metrices Table Of Contents: Mean Absolute Error. Mean Squared Error. Root Mean Squared Error. R – Squared Error Adjusted R – Squared Error. (1) Mean Absolute Error. Mean Absolute Error calculates the average difference between the calculated values and actual values. It is also known as scale-dependent accuracy as it calculates error in observations taken on the same scale. MAE provides a straightforward measure of the model’s accuracy, as it represents the average magnitude of errors without considering their direction. Formula: Example: To calculate the MAE, we follow these steps: Calculate the absolute differences between the
-

Linear Regression – Problem Statements
Linear Regression – Problem Statements (1) Marketing Promotion TV vs Radio vs Social Media Each row corresponds to an independent marketing promotion where the business uses TV, social media, radio, and influencer promotions to increase sales. The features in the data are: TV promotional budget (in “Low,” “Medium,” and “High” categories) Social media promotional budget (in millions of dollars) Radio promotional budget (in millions of dollars) Sales (in millions of dollars) Influencer size (in “Mega,” “Macro,” “Micro,” and “Nano” categories) (2) USA Optimal Product Price Prediction Dataset This dataset contains product prices from Amazon USA, with a focus on price
-
Gradient Descent Algorithm
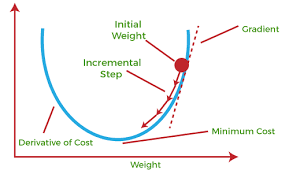
Gradient Descent Algorithm Table Of Contents: What Is Gradient Descent? Algorithm Requirements. What Is Gradient? How Gradient Descent Algorithm Works? (1) What Is Gradient Descent? Gradient descent (GD) is an iterative first-order optimisation algorithm, used to find a local minimum/maximum of a given function. This method is commonly used in machine learning (ML) and deep learning (DL) to minimise a cost/loss function (e.g. in a linear regression). Gradient Descent algorithm is the backbone of Machine Learning because whatever the loss function you give, it will find out its local minimum value. (2) Algorithm Requirements. The Gradient Descent algorithm does not work for all functions. There
